Quantcast
Channel: Networking – Daniel's Tech Blog
Viewing all 47 articles
Browse latest View live

Azure Load Balancer behavior when externalTrafficPolicy is set to Local in the Kubernetes service object

$
0
0

In one of my last blog posts I talked about running the Ambassador Kubernetes-native microservices API gateway on Azure Kubernetes Service. Specially to define and set the configuration option externalTrafficPolicy to Local on the Ambassador Kubernetes service object.

-> https://www.danielstechblog.io/running-ambassador-api-gateway-on-azure-kubernetes-service/

But have you ever asked yourself the question how the behavior of the Azure Load Balancer is in such a case? Does not matter we look at it now.

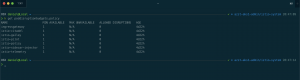
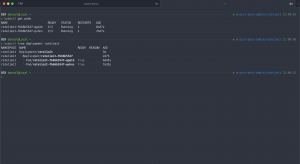
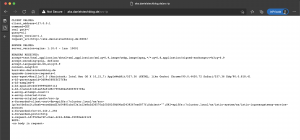
First let us have a look at two different Kubernetes service objects. One without and one with the configuration option externalTrafficPolicy set to Local. For that we run the kubectl describe command.

Ambassador service object – externalTrafficPolicy Cluster:

> kubectl describe svc ambassador
Name:                     ambassador
Namespace:                default
Labels:                   service=ambassador
Annotations:              kubectl.kubernetes.io/last-applied-configuration:
                            {"apiVersion":"v1","kind":"Service","metadata":{"annotations":{"service.beta.kubernetes.io/azure-dns-label-name":"azst-aks1-ambassador"},"...
                          service.beta.kubernetes.io/azure-dns-label-name: azst-aks1-ambassador
Selector:                 service=ambassador
Type:                     LoadBalancer
IP:                       10.0.172.186
LoadBalancer Ingress:     40.69.29.19
Port:                     <unset>  80/TCP
TargetPort:               80/TCP
NodePort:                 <unset>  32474/TCP
Endpoints:                10.240.0.254:80,10.240.0.89:80,10.240.1.114:80
Session Affinity:         None
External Traffic Policy:  Cluster

Ambassador service object – externalTrafficPolicy Local:

> kubectl describe svc ambassador
Name:                     ambassador
Namespace:                default
Labels:                   service=ambassador
Annotations:              kubectl.kubernetes.io/last-applied-configuration:
                            {"apiVersion":"v1","kind":"Service","metadata":{"annotations":{"service.beta.kubernetes.io/azure-dns-label-name":"azst-aks1-ambassador"},"...
                          service.beta.kubernetes.io/azure-dns-label-name: azst-aks1-ambassador
Selector:                 service=ambassador
Type:                     LoadBalancer
IP:                       10.0.172.186
LoadBalancer Ingress:     40.69.29.19
Port:                     <unset>  80/TCP
TargetPort:               80/TCP
NodePort:                 <unset>  32474/TCP
Endpoints:                10.240.0.254:80,10.240.0.89:80,10.240.1.114:80
Session Affinity:         None
External Traffic Policy:  Local
HealthCheck NodePort:     31019

As you can see there is more difference than the configuration setting externalTrafficPolicy between both service objects. In the case where externalTrafficPolicy is set to Local the service object gets a HealthCheck NodePort assigned. The HealthCheck NodePort is used by the Azure Load Balancer to identify, if the Ambassador pod on the node is running or not and mark the node as healthy or unhealthy.

But let us step back for a moment and looking at the standard behavior in case of a Kubernetes service object defaulting externalTrafficPolicy to Cluster.

When deploying a container application with a service object and externalTrafficPolicy set to Cluster, which you do not have to specify cause it is the default setting, every node in the cluster can serve traffic targeting this container application. The node is marked as healthy in the Azure Load Balancer backend pool. Even the node does not have a running pod of this application on it, it just forwards the traffic and that is the kind of magic provided by Kubernetes.

As said earlier with externalTrafficPolicy set to local we get the HealthCheck NodePort which ensures that only nodes that running the Ambassador pod are served by the Azure Load Balancer. The advantage beside preserving the client IP address is that we do not have any additional network hop compared to the standard configuration. Nodes not running an Ambassador pod are then marked as unhealthy in the Azure Load Balancer backend pool and are not serving any traffic for the Ambassador API gateway deployment.

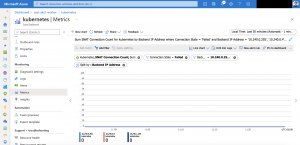
Here are some Azure diagnostic log entries showing the different states.

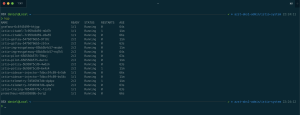
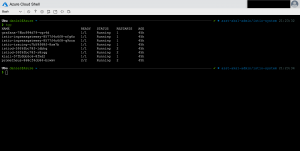
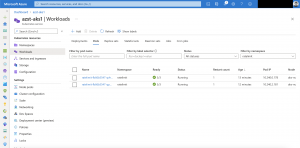
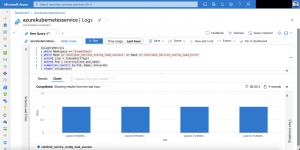
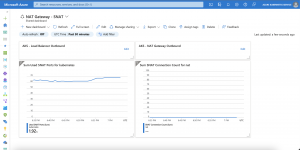
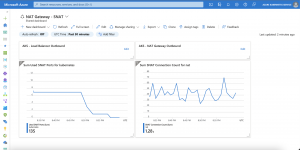
First a scenario where three Ambassador pods are running across all three nodes in the Azure Kubernetes Service cluster. Cause we do not have a degradation of our Load Balancer backend pool there will not be any entries in the diagnostic log.

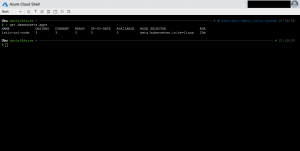
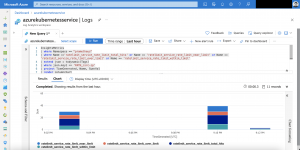
Now we are scaling down the Ambassador deployment to two replicas and we get the following entry in the diagnostic log.

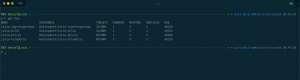
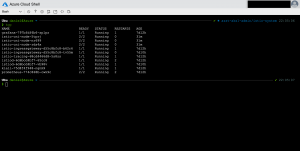
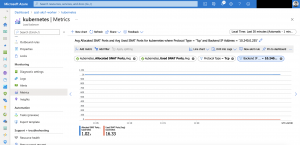
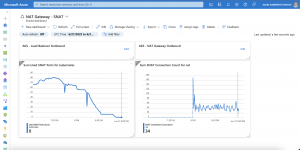
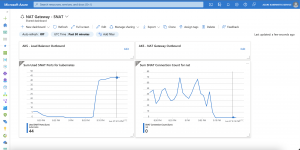
{ "time": "2019-04-04T12:33:47.0641700Z", "systemId": "REDACTED", "category": "LoadBalancerProbeHealthStatus", "resourceId": "REDACTED", "operationName": "LoadBalancerProbeHealthStatus", "properties": {"publicIpAddress":"40.69.29.19","port":80,"totalDipCount":3,"dipDownCount":1,"healthPercentage":66.666667}}

This entry shows us that the Azure Load Balancer sets the status of the corresponding node in the backend pool to unhealthy. When scaling back to three replicas the node will be marked again as healthy and continues to serve traffic.

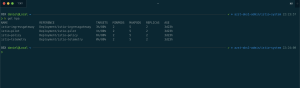
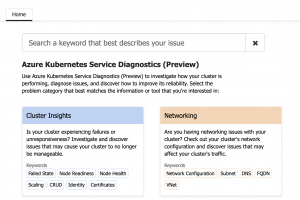
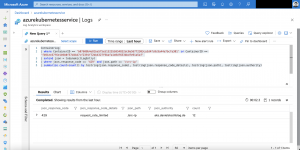
{ "time": "2019-04-04T13:07:34.3877875Z", "systemId": "REDACTED", "category": "LoadBalancerProbeHealthStatus", "resourceId": "REDACTED", "operationName": "LoadBalancerProbeHealthStatus", "properties": {"publicIpAddress":"40.69.29.19","port":80,"totalDipCount":3,"dipDownCount":0,"healthPercentage":100.000000}}

Azure diagnostic logs for the Azure Load Balancer are not enabled by default. If you want to turn them on just follow this guide

-> https://docs.microsoft.com/en-us/azure/load-balancer/load-balancer-monitor-log

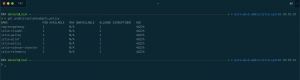
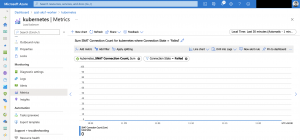
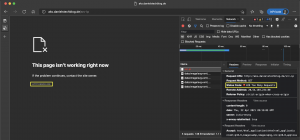
Make sure you select LoadBalancerProbeHealthStatus as seen in the screenshot.

lbexternaltrafficpolicy1

Der Beitrag Azure Load Balancer behavior when externalTrafficPolicy is set to Local in the Kubernetes service object erschien zuerst auf Daniel's Tech Blog.


Configure Azure Traffic Manager endpoint monitoring for container applications behind an ingress controller on AKS

$
0
0

Running an ingress controller on Azure Kubernetes Service requires configuration of the Azure Traffic Manager endpoint monitoring options when Traffic Manager is used in front of it.

In this blog post I will show you an example configuration of the Traffic Manager endpoint monitoring for a container application behind the Ambassador API gateway running on AKS.

First, here is the Kubernetes service object configuration of the Ambassador API gateway.

apiVersion: v1
kind: Service
metadata:
  labels:
    service: ambassador
  name: ambassador
  annotations:
    service.beta.kubernetes.io/azure-dns-label-name: azst-aks1-ambassador
spec:
  type: LoadBalancer
  externalTrafficPolicy: Local
  ports:
  - port: 80
    targetPort: 80
  selector:
    service: ambassador

The specialty in this configuration is the Azure DNS label name annotation. We need this annotation since otherwise we cannot select the Azure Public IP as an Azure endpoint in Azure Traffic Manager.

tmendpointmonitoring01

Next let us have a look at the Kubernetes service object configuration of the container application.

apiVersion: v1
kind: Service
metadata:
  name: go-webapp
  labels:
    app: go-webapp
  annotations:
    getambassador.io/config: |
      ---
        apiVersion: ambassador/v1
        kind:  Mapping
        name:  go-webapp
        prefix: /
        host: aks.trafficmanager.net
        service: go-webapp.default.svc.cluster.local
        add_request_headers:
          l5d-dst-override: go-webapp.default.svc.cluster.local:80
spec:
  ports:
  - port: 80
    targetPort: 8080
  selector:
    app: go-webapp

In the Ambassador configuration annotation, I am specifying as host the Azure Traffic Manager URL / DNS name.

When we now look at the Traffic Manager endpoint the monitor status is in degraded state instead of online. The reason for that is the missing configuration adjustment to the Traffic Manager endpoint monitoring.

tmendpointmonitoring02

Without any adjustment the endpoint monitoring targets directly the Ambassador installation as ingress controller and Ambassador returns per default the 404 HTTP code. The endpoint monitoring does not contain a specific hostname in the customer header in this case. Therefor Ambassador does not know to which container application in the Kubernetes cluster it should forward the endpoint monitoring request.

Solving this issue just click onto the Configuration tab and set the hostname under Custom Header settings.

host:aks.trafficmanager.net

tmendpointmonitoring03

Shortly after hitting the Save button the Traffic Manager endpoint changes its monitor status to online.

tmendpointmonitoring04

Keep in mind that depending on the configuration how the ingress controller publishes the container application, the Azure Traffic Manager endpoint monitoring configuration might be different to the example I showed you in this blog post.

Der Beitrag Configure Azure Traffic Manager endpoint monitoring for container applications behind an ingress controller on AKS erschien zuerst auf Daniel's Tech Blog.

Running Linkerd on Azure Kubernetes Service

$
0
0

Certainly, you have heard the term service mesh in the context of Kubernetes. Istio is one of the service mesh implementations that you might have heard of mostly. Beside Istio, Linkerd is the other popular service mesh implementation for Kubernetes.

In this blog post I talk about the installation of Linkerd and running it on Azure Kubernetes Service. The easiest part to get started with Linkerd is just following the guide on the Linkerd website.

-> https://linkerd.io/2/getting-started/

First install the Linkerd CLI so we can set up our test installation.

curl -sL https://run.linkerd.io/install | sh
export PATH=$PATH:$HOME/.linkerd2/bin
linkerd version

akslinkerd01

Then you should run the following command to check all prerequisites for Linkerd.

linkerd check --pre

akslinkerd02

Afterwards we can execute the install command to get Linkerd running on Azure Kubernetes Service.

linkerd install | kubectl apply -f -

We can check the installation status with the command linkerd check.

akslinkerd03akslinkerd03_01

It is the simplest installation you can get. But it is a good starting point to get to know Linkerd and its capabilities.

Linkerd also brings a dashboard along that can be reached via linkerd dashboard &.

akslinkerd04akslinkerd05

For more advanced production ready scenarios you should look into the Linkerd CLI install reference.

-> https://linkerd.io/2/reference/cli/install/

If you want to have the automatic proxy injection capability enabled for example, you can use the following commands to install Linkerd with it enabled or update an existing installation.

linkerd install --proxy-auto-inject | kubectl apply -f -
linkerd upgrade --proxy-auto-inject | kubectl apply -f -

The automatic proxy injection deploys the Linkerd sidecar container to new deployments without any manual interaction. For that you add the following annotation to a namespace to enable it for the whole namespace and every new deployment in it or just per deployment. The latter is what I recommend.

...
    metadata:
      annotations:
        linkerd.io/inject: enabled
...

Another example for that you would like to customize the default Linkerd install command is the usage of the Horizontal Pod Autoscaler for your container application deployments. The HPA requires that every container in a pod has set values for resource requests like CPU or memory depending on what you have defined in your HPA configuration. Otherwise the HPA does not work for the container application.

Per default the Linkerd sidecar container has not set any resource requests. When looking at the Linkerd CLI install reference you find the parameters –proxy-cpu-request and –proxy-memory-request to specify the resource request values for the sidecar container.

linkerd install --proxy-cpu-request 100m --proxy-memory-request 50Mi | kubectl apply -f -
linkerd upgrade --proxy-cpu-request 100m --proxy-memory-request 50Mi | kubectl apply -f -

As already said the default installation is simple and a good starting point to get familiar with Linkerd and the service mesh concept. Throughout your testing you will adjust and update your Linkerd installation pretty fast to cover more advanced production ready scenarios.

Der Beitrag Running Linkerd on Azure Kubernetes Service erschien zuerst auf Daniel's Tech Blog.

Setting custom upstream nameservers for CoreDNS in Azure Kubernetes Service

$
0
0

Last year I have written a blog post about configuring kube-dns in Azure Kubernetes Service to provide a custom nameserver for DNS name resolution.

-> https://www.danielstechblog.io/using-custom-dns-server-for-domain-specific-name-resolution-with-azure-kubernetes-service/

Since then Kubernetes switched to CoreDNS and AKS as well. Today I am not talking about the topic in my previous blog post, that will follow the next days, instead I am focusing on the custom upstream nameservers configuration for CoreDNS.

You might think that this is simple looking at the official Kubernetes & AKS docs, and you only need to apply the following ConfigMap to your AKS cluster. Be prepared!

-> https://kubernetes.io/docs/tasks/administer-cluster/dns-custom-nameservers/#coredns-configuration-equivalent-to-kube-dns
-> https://docs.microsoft.com/en-us/azure/aks/coredns-custom

apiVersion: v1
kind: ConfigMap
metadata:
  name: coredns-custom
  namespace: kube-system
data:
  Corefile.override: |
        forward . 8.8.8.8 8.8.4.4

First, you stumble across the issue that the ConfigMap is not loaded by CoreDNS after applying the template with kubectl apply -f configMap.yaml. Indeed, this is an issue discussed on the CoreDNS and AKS GitHub repositories. You must delete/restart the CoreDNS pods to get your custom ConfigMap settings loaded by CoreDNS. Just run the following command and you should be fine. But you need at least kubectl with version 1.15.0 for it.

kubectl -n kube-system rollout restart deployment coredns

If you then take a look into the CoreDNS logs with kubectl logs, you are greeted by lots of DNS name resolution errors.

[WARNING] No files matching import glob pattern: custom/*.server
.:53
2019-08-06T21:23:47.180Z [INFO] CoreDNS-1.3.1
2019-08-06T21:23:47.180Z [INFO] linux/amd64, go1.11.4, 6b56a9c
CoreDNS-1.3.1
linux/amd64, go1.11.4, 6b56a9c
2019-08-06T21:23:47.180Z [INFO] plugin/reload: Running configuration MD5 = 3d857228607ba1ff23e0d609eae89195
2019-08-06T21:23:54.410Z [ERROR] plugin/errors: 2 v1-go-webapp.default.svc.cluster.local.xbmjdg5ws0bufpxuyfmkdn5ihb.fx.internal.cloudapp.net. A: read udp 10.240.0.253:33645->8.8.8.8:53: i/o timeout
2019-08-06T21:23:54.733Z [ERROR] plugin/errors: 2 helloworld-function-figlet.default.svc.cluster.local.xbmjdg5ws0bufpxuyfmkdn5ihb.fx.internal.cloudapp.net. A: read udp 10.240.0.253:51913->8.8.8.8:53: i/o timeout
2019-08-06T21:23:55.264Z [ERROR] plugin/errors: 2 akscnicalc-function-akscnicalc.default.svc.cluster.local.xbmjdg5ws0bufpxuyfmkdn5ihb.fx.internal.cloudapp.net. A: read udp 10.240.0.253:46457->8.8.8.8:53: i/o timeout
....

The reason for that is Azure’s internal DNS name resolution in a Virtual Network.

-> https://docs.microsoft.com/en-us/azure/virtual-network/virtual-networks-name-resolution-for-vms-and-role-instances#name-resolution-that-uses-your-own-dns-server

Per default every pod in AKS / Kubernetes uses the ClusterFirst dnsPolicy.

-> https://kubernetes.io/docs/concepts/services-networking/dns-pod-service/#pod-s-dns-policy

Every request that does not match the configured cluster domain suffix is sent to the upstream nameserver received from the /etc/resolv.conf file on the worker nodes. Guess what, the nameserver referenced in the /etc/resolv.conf is the Azure DNS virtual server 168.63.129.16 that provides DNS name resolution to the VMs in Azure, if you do not specify a custom DNS server in the Virtual Network settings. Because we have overwritten the upstream nameserver with the Google DNS servers, they do not know the domain xbmjdg5ws0bufpxuyfmkdn5ihb.fx.internal.cloudapp.net.

-> https://docs.microsoft.com/en-us/azure/virtual-network/what-is-ip-address-168-63-129-16

So, to get our configuration working without flooding the CoreDNS log with DNS name resolution errors we specify a domain specific name resolution for internal.cloudapp.net.

The following ConfigMap template contains the necessary configuration.

apiVersion: v1
kind: ConfigMap
metadata:
  name: coredns-custom
  namespace: kube-system
data:
  Corefile.override: |
        forward . 8.8.8.8 8.8.4.4
  azure.server: |
    internal.cloudapp.net:53 {
        errors
        cache 30
        proxy . 168.63.129.16
    }

-> https://github.com/neumanndaniel/kubernetes/blob/master/coredns/aksCoreDnsConfigMap.yaml

Again, we run  kubectl apply -f configMap.yaml && kubectl -n kube-system rollout restart deployment coredns to apply the changes to the custom CoreDNS ConfigMap object and restarting the CoreDNS pods.

When you now take a look into the CoreDNS log your output should look like this.

.:53
internal.cloudapp.net.:53
2019-08-06T21:45:01.558Z [INFO] CoreDNS-1.3.1
2019-08-06T21:45:01.558Z [INFO] linux/amd64, go1.11.4, 6b56a9c
CoreDNS-1.3.1
linux/amd64, go1.11.4, 6b56a9c
2019-08-06T21:45:01.558Z [INFO] plugin/reload: Running configuration MD5 = 3d857228607ba1ff23e0d609eae89195

Finally, CoreDNS uses the custom upstream nameservers for the DNS name resolution.

In the next blog post I am focusing on the details in the data section of the custom ConfigMap object for CoreDNS in AKS.

Der Beitrag Setting custom upstream nameservers for CoreDNS in Azure Kubernetes Service erschien zuerst auf Daniel's Tech Blog.

Configuration options for CoreDNS in Azure Kubernetes Service

$
0
0

In my last blog post I have shown you the configuration of custom upstream nameservers for CoreDNS in AKS.

-> https://www.danielstechblog.io/setting-custom-upstream-nameservers-for-coredns-in-azure-kubernetes-service/

But there are more configuration options available to customize your CoreDNS experience. We will focus at some of them today.

First, let us have a look at the two options in the custom-coredns ConfigMap. We get a .override and a .server option. Where the .override option allows us to change the system configuration of CoreDNS stored in the coredns ConfigMap on AKS.

apiVersion: v1
kind: ConfigMap
metadata:
  name: coredns-custom
  namespace: kube-system
data:
  Corefile.override: |
        forward . 8.8.8.8 8.8.4.4

The .server option let us provide specific options for domains that should not or cannot be served by the default nameservers.

apiVersion: v1
kind: ConfigMap
metadata:
  name: coredns-custom
  namespace: kube-system
data:
  azure.server: |
    internal.cloudapp.net:53 {
        errors
        cache 30
        proxy . 168.63.129.16
    }

Looking at the official CoreDNS plugin list, you discover that there are a lot of plugins available.

-> https://coredns.io/plugins/
-> https://coredns.io/explugins/

In the default configuration on AKS CoreDNS uses the plugins errors, health, kubernetes, prometheus, proxy, cache, loop, reload, loadbalance and import.

The customization of the default system configuration of CoreDNS like changing the upstream nameservers was the topic in the blog post mentioned earlier.

-> https://www.danielstechblog.io/setting-custom-upstream-nameservers-for-coredns-in-azure-kubernetes-service/

So, we will not focus on that today. In the following example for the domain k8s.local I am using the plugins log, errors, cache and proxy.

Per default you should always use the plugins errors, cache and proxy. At least the proxy or forward plugin is required to forward requests to the specified nameserver or nameservers. The cache plugin caches requests for the specified amount of time which is specified in seconds. Ultimately the errors plugin logs errors to stdout and is useful for troubleshooting purposes.

apiVersion: v1
kind: ConfigMap
metadata:
  name: coredns-custom
  namespace: kube-system
data:
  k8s.local.server: |
    k8s.local:53 {
        errors
        cache 30
        log
        proxy . 172.16.0.4
    }

The log plugin logs every request to the stdout interface of the CoreDNS pods.

kl coredns-75544f5d88-57pgp
[WARNING] No files matching import glob pattern: custom/*.override
.:53
k8s.local.:53
2019-08-23T21:18:55.910Z [INFO] CoreDNS-1.3.1
2019-08-23T21:18:55.910Z [INFO] linux/amd64, go1.11.4, 6b56a9c
CoreDNS-1.3.1
linux/amd64, go1.11.4, 6b56a9c
2019-08-23T21:18:55.910Z [INFO] plugin/reload: Running configuration MD5 = 3d857228607ba1ff23e0d609eae89195
2019-08-23T21:23:37.167Z [INFO] 10.240.0.242:57045 - 4864 "A IN aks.k8s.local. udp 31 false 512" NOERROR qr,aa,rd,ra 60 0.002444787s
2019-08-23T21:23:37.167Z [INFO] 10.240.0.242:57045 - 4864 "AAAA IN aks.k8s.local. udp 31 false 512" NOERROR qr,aa,rd,ra 89 0.002917085s
2019-08-23T21:23:39.666Z [INFO] 10.240.0.242:57045 - 4864 "AAAA IN aks.k8s.local. udp 31 false 512" NOERROR qr,rd,ra 89 0.000067299s
2019-08-23T21:24:50.975Z [INFO] 10.240.0.242:58434 - 5120 "AAAA IN aks-engine.k8s.local. udp 38 false 512" NOERROR qr,aa,rd,ra 96 0.001471193s
2019-08-23T21:24:50.976Z [INFO] 10.240.0.242:58434 - 5120 "A IN aks-engine.k8s.local. udp 38 false 512" NOERROR qr,aa,rd,ra 74 0.002443388s
2019-08-23T21:24:53.476Z [INFO] 10.240.0.242:58434 - 5120 "AAAA IN aks-engine.k8s.local. udp 38 false 512" NOERROR qr,rd,ra 96 0.0001094s

For specific domains it might be useful to get the request in the CoreDNS logs but activating it in the system configuration with the .override option would cause a lot of noise in the logs.

So, if you need the logging functionality only activate it for specific domains with the .server option.

Getting the log output into Azure Monitor for containers requires additional configuration. Cause the CoreDNS pods are running in the kube-system namespace.

-> https://www.danielstechblog.io/tweaking-data-collection-for-azure-monitor-for-containers/

I hope you got an idea how to customize the CoreDNS settings on AKS covering your use cases.

Der Beitrag Configuration options for CoreDNS in Azure Kubernetes Service erschien zuerst auf Daniel's Tech Blog.

Secure Kubernetes API server access in Azure Kubernetes Service

$
0
0

Running Kubernetes at a cloud provider especially managed Kubernetes like AKS or GKE provides you with a solid foundation and applied security best practices for the managed master control plane.

But there is one downside, the public accessible API endpoint to control the Kubernetes cluster. Even the API endpoint is only exposed via HTTPS and access is secured via the Azure Active Directory integration and certificates, you may want a bit more.

Currently, you can achieve this with explicit IP whitelisting for accessing the API endpoint or using the newly announced public preview of having a private AKS cluster. The cluster is then only accessible via the Virtual Network without having a public API endpoint.

Today we talk about the explicit IP whitelisting feature for the API endpoint that is already GA.

The API endpoint whitelisting feature requires the Standard Load Balancer to be used with AKS. Except if you are matching a special condition.

-> https://docs.microsoft.com/en-us/azure/aks/api-server-authorized-ip-ranges

So, when you are using AKS with a Standard Load Balancer you do not need to redeploy the cluster to use the whitelisting feature. You can configure and use it via the Azure CLI, Azure Resource Manager templates or Terraform.

module "aks" {
  source = "../modules/aks"
  resource_group_name = "azst-aks1"
  location            = "North Europe"
  ...
  name               = "azst-aks1"
  kubernetes_version = "1.14.8"
  vnet_subnet_id     = module.virtual_network.subnet_id
  aad_group_name     = "AKS-Admins"
  api_auth_ips = [
    x.x.x.x/32
  ]
  ...
}

In the above Terraform template I just whitelisted a single IP address. For instance, the IP address of my home office. There is no need to whitelist the outbound IP address of the AKS SLB to ensure communication between the kubelets and the API server. This is done automatically by Azure, when you enable the whitelisting.

But whitelisting the home office or office IP address is only one step. Do not forget your CI/CD system that you use for your deployments onto the AKS cluster. Especially when you are using hosted build agent that are not running in the AKS cluster itself.

Staying in the Azure universe we take a look into whitelisting Azure DevOps.

Depending in which Azure region / geography you created the Azure DevOps organization you whitelist a few or a couple of Azure regions with their respective IP address ranges.

Look into the organizations settings to identify the Azure region you are in.

As seen in the screenshot my Azure DevOps organization is in West Europe. Therefore, we need at least to whitelist all IP address ranges Azure uses for the West Europe region.

Microsoft publishes every week a new JSON file that includes the current IP address ranges for a specific Azure service or region.

-> https://www.microsoft.com/en-us/download/details.aspx?id=56519

Since the JSON file has thousand lines and more, we use the following shell command to get the ranges for West Europe.

jq '.values[] | select(.name | contains ("AzureCloud.westeurope")) | .properties.addressPrefixes' ServiceTags_Public_20191209.json

Whitelisting them enables us at least to successfully verify the Kubernetes service connection in Azure DevOps.

Without the whitelisting the verification fails as seen above.

But only whitelisting West Europe does not guarantee successful build or release pipelines that need to talk to the AKS API server.

For Azure DevOps we must whitelist also the North Europe region to cover the Azure geography Europe in our case.

Microsoft itself documented it, but not highlighting it directly.

Your hosted agents run in the same Azure geography as your organization. Each geography contains one or more regions, and while your agent may run in the same region as your organization, it is not guaranteed to do so. To obtain the complete list of possible IP ranges for your agent, you must use the IP ranges from all of the regions that are contained in your geography. For example, if your organization is located in the United States geography, you must use the IP ranges for all of the regions in that geography.

-> https://docs.microsoft.com/en-us/azure/devops/pipelines/agents/hosted?view=azure-devops#agent-ip-ranges

In the end Azure DevOps does not guarantee in which region in the specific Azure geography it is using the hosted build agents. There for all regions in an Azure geography must be whitelisted.

Let us now take a look at the complete Terraform template whitelisting West Europe and North Europe.

module "aks" {
  source = "../modules/aks"
  resource_group_name = "azst-aks1"
  location            = "North Europe"
  ...
  name               = "azst-aks1"
  kubernetes_version = "1.14.8"
  vnet_subnet_id     = module.virtual_network.subnet_id
  aad_group_name     = "AKS-Admins"
  api_auth_ips = concat(
    local.azure_northeurope_ip_ranges,
    local.azure_westeurope_ip_ranges
  )
  ...
}
locals {
  azure_westeurope_ip_ranges = [
    "13.69.0.0/17",
    "13.73.128.0/18",
    ...
  ]
  azure_northeurope_ip_ranges = [
    "13.69.128.0/17",
    "13.70.192.0/18",
    ...
  ]
}

I am using local values to specify the IP address ranges for both regions at the end of my Terraform template to keep it clear. The variable api_auth_ips expects a list of strings as input. Therefore, we concatenate the two lists specified as local values.

After applying the new whitelist our build and release pipelines in Azure DevOps continuing to work.

A nice side-effect of whitelisting the whole regional IP address ranges is the whitelisting of Azure Cloud Shell as well.

If you want to disable the whitelisting on your AKS cluster, just provide an empty list in the Terraform template.

module "aks" {
  source = "../modules/aks"
  resource_group_name = "azst-aks1"
  location            = "North Europe"
  ...
  name               = "azst-aks1"
  kubernetes_version = "1.14.8"
  vnet_subnet_id     = module.virtual_network.subnet_id
  aad_group_name     = "AKS-Admins"
  api_auth_ips = []
  ...
}

Alternatively run the following Azure CLI command.

az aks update --resource-group azst-aks1 --name azst-aks1 --api-server-authorized-ip-ranges "" --verbose

The Terraform modules I used in the above code snippets can be found on GitHub.

-> https://github.com/neumanndaniel/terraform/tree/master/modules

Der Beitrag Secure Kubernetes API server access in Azure Kubernetes Service erschien zuerst auf Daniel's Tech Blog.

Install a high available Istio control plane on Azure Kubernetes Service

$
0
0

Lately I worked intensively with Istio and focused especially on the topic high availability of the Istio control plane.

When you install Istio with the default profile, as mentioned in the Istio documentation, you get a non-high available control plane.

istioctl manifest apply \
--set values.global.mtls.enabled=true \
--set values.global.controlPlaneSecurityEnabled=true

Per default Istio gets installed with a PodDisruptionBudget for every control plane component except for 3rd party services like Prometheus or Grafana.

All PDBs specifying a minimum availability of one pod for the control plane components. Beside that the Istio Ingress Gateway, Pilot, Policy (Mixer) and Telemetry (Mixer) have an HPA assigned for autoscaling.

That leaves the Istio components Citadel, Galley and the Sidecar Injector with their PDBs as a blocking component for specific operations in the AKS cluster. Even the HPA covered components can be blocking, when only one pod is running.

Which operations are blocked by the PDBs?

Cluster upgrade, cluster autoscaler scale-in and automatic node reboot operations, when using kured in the AKS cluster.

So, pretty much every useful operation in AKS regarding the underlying nodes is blocked.

The solution can be an easy one deploying Istio without the default PDBs.

istioctl manifest apply \
--set values.global.mtls.enabled=true \
--set values.global.controlPlaneSecurityEnabled=true \
--set values.global.defaultPodDisruptionBudget.enabled=false

But that weakens a non-high available control plane even more.

The best solution to solve the blocking operations issue is a high available Istio control plane.

Beside solving the issue, we add more robustness to the Istio Service Mesh itself. The minimal required setup for an HA Istio control plane consists of two pods for each Istio component except 3rd party services.

The following command installs an HA Istio control plane into an Azure Kubernetes Service cluster.

istioctl manifest apply \
--set values.global.mtls.enabled=true \
--set values.global.controlPlaneSecurityEnabled=true \
--set gateways.components.ingressGateway.k8s.hpaSpec.minReplicas=2 \
--set trafficManagement.components.pilot.k8s.hpaSpec.minReplicas=2 \
--set policy.components.policy.k8s.hpaSpec.minReplicas=2 \
--set telemetry.components.telemetry.k8s.hpaSpec.minReplicas=2 \
--set configManagement.components.galley.k8s.replicaCount=2 \
--set autoInjection.components.injector.k8s.replicaCount=2 \
--set security.components.citadel.k8s.replicaCount=2 \
--set values.grafana.enabled=true \
--set values.tracing.enabled=true \
--set values.sidecarInjectorWebhook.rewriteAppHTTPProbe=true \
--set values.gateways.istio-ingressgateway.sds.enabled=true

Afterwards the PDBs output looks different and presents us with the information that a disruption is now allowed.

Thus, cluster upgrade, cluster autoscaler scale-in and automatic node reboot operations via kured are possible again.

Istio Sidecar Injector PDB issue

If you took a deeper look at the screenshot of the PDBs output, you recognized already that the allowed disruptions column for the Sidecar Injector states 0 instead of 1. The reason for that is a wrong label selector in the PDB or a wrong label in the Deployment definition for the Sidecar Injector. Depends on which definition is your source of truth. My source of truth is the Deployment definition and I have taken a deeper look into the PDB.

> kubectl describe poddisruptionbudgets.policy istio-sidecar-injector
Name:           istio-sidecar-injector
Namespace:      istio-system
Min available:  1
Selector:       app=sidecar-injector,istio=sidecar-injector,release=istio
Status:
    Allowed disruptions:  0
    Current:              0
    Desired:              1
    Total:                0
Events:
  Type    Reason  Age                      From               Message
  ----    ------  ----                     ----               -------
  Normal  NoPods  5m46s (x922 over 7h46m)  controllermanager  No matching pods found

As you can see the following labels are set for the selector in the PDB app=sidecar-injector,istio=sidecar-injector,release=istio.

> kubectl describe deployment istio-sidecar-injector
Name:                   istio-sidecar-injector
Namespace:              istio-system
...
Labels:                 app=sidecarInjectorWebhook
                        istio=sidecar-injector
                        operator.istio.io/component=Injector
                        operator.istio.io/managed=Reconcile
                        operator.istio.io/version=1.4.3
                        release=istio
...
Selector:               istio=sidecar-injector
...
Pod Template:
  Labels:           app=sidecarInjectorWebhook
                    chart=sidecarInjectorWebhook
                    heritage=Tiller
                    istio=sidecar-injector
                    release=istio

In the Deployment definition the labels of the pod template are app=sidecarInjectorWebhook,istio=sidecar-injector,release=istio.

Because label selectors are AND and not OR based, all label selectors must match to fulfill the condition.

So, we need to run the istioctl manifest apply with the additional parameter --set autoInjection.components.injector.k8s.podDisruptionBudget.selector.matchLabels.app=sidecarInjectorWebhook again to overwrite the default label selector app=sidecar-injector of the Sidecar Injector PDB.

istioctl manifest apply \
--set values.global.mtls.enabled=true \
--set values.global.controlPlaneSecurityEnabled=true \
--set gateways.components.ingressGateway.k8s.hpaSpec.minReplicas=2 \
--set trafficManagement.components.pilot.k8s.hpaSpec.minReplicas=2 \
--set policy.components.policy.k8s.hpaSpec.minReplicas=2 \
--set telemetry.components.telemetry.k8s.hpaSpec.minReplicas=2 \
--set configManagement.components.galley.k8s.replicaCount=2 \
--set autoInjection.components.injector.k8s.replicaCount=2 \
--set autoInjection.components.injector.k8s.podDisruptionBudget.selector.matchLabels.app=sidecarInjectorWebhook \
--set security.components.citadel.k8s.replicaCount=2 \
--set values.grafana.enabled=true \
--set values.tracing.enabled=true \
--set values.sidecarInjectorWebhook.rewriteAppHTTPProbe=true \
--set values.gateways.istio-ingressgateway.sds.enabled=true

After the successful apply we see now that allowed disruptions is set to 1.

kubectl describe poddisruptionbudgets.policy istio-sidecar-injector
Name:           istio-sidecar-injector
Namespace:      istio-system
Min available:  1
Selector:       app=sidecarInjectorWebhook,istio=sidecar-injector,release=istio
Status:
    Allowed disruptions:  1
    Current:              2
    Desired:              1
    Total:                2
Events:
  Type    Reason  Age                      From               Message
  ----    ------  ----                     ----               -------
  Normal  NoPods  4m51s (x932 over 7h50m)  controllermanager  No matching pods found

I will open an issue in the Istio GitHub repository in the next couple of days regarding the above-mentioned issue.

Appendix A – Istio HA

For the sake of completeness, I am referencing the following GitHub issue.

-> https://github.com/istio/istio/issues/18565

Not so long ago Istio had issues, when more than one pod of the components Citadel, Galley and the Sidecar Injector were running in the same Kubernetes cluster.

As stated in the GitHub issue this has been solved for the mentioned Istio components.

I used Istio in version 1.4.2 and 1.4.3 while doing the HA configuration and deployment of the control plane.

Appendix B – AKS Istio how-to guide

For getting started with Istio on AKS you can check Azure docs for the how-to guide.

-> https://docs.microsoft.com/en-us/azure/aks/servicemesh-istio-about

Der Beitrag Install a high available Istio control plane on Azure Kubernetes Service erschien zuerst auf Daniel's Tech Blog.

High available control plane with Istio 1.5 on Azure Kubernetes Service

$
0
0

Back in January I have written a blog post about installing the Istio control plane on AKS in HA mode.

-> https://www.danielstechblog.io/install-a-high-available-istio-control-plane-on-azure-kubernetes-service/

Since the release of Istio 1.5 this month the overall architecture of the Istio control plane has changed.

-> https://istio.io/news/releases/1.5.x/announcing-1.5/#introducing-istiod

With the introduction of Istiod the number of deployed pods get dramatically reduced, when running a high available Istio control plane to at least four pods. Those four pods are two Istiod pods, representing the core of the control plane, and two Istio ingress gateway pods.

Beside that you might have some more pods representing add-on components like Grafana, Prometheus and Kiali.

Instead of using istioctl with --set option, I transferred those settings into a YAML template utilizing the IstioOperator API more easily.

apiVersion: install.istio.io/v1alpha1
kind: IstioOperator
spec:
  addonComponents:
    grafana:
      enabled: true
    tracing:
      enabled: true
    kiali:
      enabled: true
    prometheus:
      enabled: true
  components:
    ingressGateways:
    - enabled: true
      k8s:
        hpaSpec:
          minReplicas: 2
        overlays:
        - apiVersion: v1
          kind: Service
          name: istio-ingressgateway
          patches:
          - path: spec.ports
            value:
            - name: status-port
              port: 15020
              targetPort: 15020
            - name: http2
              port: 80
              targetPort: 80
            - name: https
              port: 443
              targetPort: 443
    pilot:
      enabled: true
      k8s:
        hpaSpec:
          minReplicas: 2
        overlays:
        - apiVersion: policy/v1beta1
          kind: PodDisruptionBudget
          name: istiod
          patches:
          - path: spec.selector.matchLabels
            value:
              app: istiod
              istio: pilot
  values:
    global:
      mtls:
        enabled: true
      controlPlaneSecurityEnabled: true
      proxy:
        accessLogFile: "/dev/stdout"
        accessLogEncoding: "JSON"
    gateways:
      istio-ingressgateway:
        sds:
          enabled: true
    sidecarInjectorWebhook:
      rewriteAppHTTPProbe: true

As you see in the template, I am setting the HPA minReplicas to 2 and thus ensure having a minimal HA setup for the Istio control plane.

Furthermore, I am using the overlays option to overwrite some specific settings.

Istio ingress gateway – Reduce number of exposed ports

My initial intention here came from a cost perspective regarding the costs of Standard Load Balancer rules in Azure. But it is also a good approach from the security perspective to only expose necessary ports.

In my case port 80, 443 and 15020 for the Envoy proxy health check endpoint.

...
        overlays:
        - apiVersion: v1
          kind: Service
          name: istio-ingressgateway
          patches:
          - path: spec.ports
            value:
            - name: status-port
              port: 15020
              targetPort: 15020
            - name: http2
              port: 80
              targetPort: 80
            - name: https
              port: 443
              targetPort: 443
...

Istiod PodDisruptionBudget issue

Same issue as described in my previous blog post, but now just for another component. The PDB for Istiod has three labels for the selector defined.

❯ kubectl describe poddisruptionbudgets.policy istiod
Name:           istiod
Namespace:      istio-system
Min available:  1
Selector:       app=istiod,istio=pilot,release=istio
Status:
    Allowed disruptions:  0
    Current:              0
    Desired:              1
    Total:                0
Events:
  Type    Reason  Age                From               Message
  ----    ------  ----               ----               -------
  Normal  NoPods  27s (x4 over 58s)  controllermanager  No matching pods found

Unfortunately, the Istiod Kubernetes Deployment template has only two of them defined.

When using selector labels, you need a match of all of them not only a partial match. Therefore, I am overwriting the PDB selector labels to only include the ones specified in the Kubernetes Deployment template.

...
        overlays:
        - apiVersion: policy/v1beta1
          kind: PodDisruptionBudget
          name: istiod
          patches:
          - path: spec.selector.matchLabels
            value:
              app: istiod
              istio: pilot
...

This ensures a working PDB for Istiod.

❯ kubectl describe poddisruptionbudgets.policy istiod
Name:           istiod
Namespace:      istio-system
Min available:  1
Selector:       app=istiod,istio=pilot
Status:
    Allowed disruptions:  1
    Current:              2
    Desired:              1
    Total:                2
Events:
  Type    Reason  Age                  From               Message
  ----    ------  ----                 ----               -------
  Normal  NoPods  70s (x6 over 2m41s)  controllermanager  No matching pods found

Appendix A – IstioOperator API templates

You can find the IstioOperator API template for Istio 1.5 under the following link.

-> https://github.com/neumanndaniel/kubernetes/blob/master/istio/istio-1.5.yaml

I also transferred the istioctl command from my previous blog post targeting Istio 1.4 to an IstioOperator API template.

-> https://github.com/neumanndaniel/kubernetes/blob/master/istio/istio-1.4.yaml

Der Beitrag High available control plane with Istio 1.5 on Azure Kubernetes Service erschien zuerst auf Daniel's Tech Blog.


Switching to Istio CNI plugin on Azure Kubernetes Service

$
0
0

You might question yourself, why the switch to the Istio CNI plugin might be useful?

Istio uses, and other services meshes too, an init container to adjust the iptables rules for redirecting network traffic to/from the sidecar proxy container. The init container uses NET_ADMIN and NET_RAW capabilities to do the iptables changes and thus has more capabilities than per default. Exactly one capability more, cause NET_RAW is a default capability in Kubernetes.

When you are using PSPs or Gatekeeper (Open Policy Agent) to prohibit NET_ADMIN for instance, then you need to define exceptions for it that apply to all namespaces you deploy your applications with the Istio sidecar proxy enabled to.

Here comes the Istio CNI plugin into play. As a cluster admin you just deploy Istio with the CNI plugin enabled. Then you only have one running Istio CNI pod per node as the Istio CNI plugin operates as a DaemonSet. Setting up the network traffic redirection is now handled by the Istio CNI plugin. So, you only need to exclude the istio-system namespace from Gatekeeper or define a separate PSP for it instead of lowering your security restrictions. This in the end reduces the security risk and makes your application deployments more secure.

You can switch a running Istio deployment from the default configuration with an init container to the CNI plugin.

Just add the following additional lines to the YAML template according to the Istio documentation.

-> https://istio.io/docs/setup/additional-setup/cni/

apiVersion: install.istio.io/v1alpha1
kind: IstioOperator
spec:
  addonComponents:
    grafana:
      enabled: true
    tracing:
      enabled: true
    kiali:
      enabled: true
    prometheus:
      enabled: true
  components:
    cni:
      enabled: true
...

You should exclude the standard system namespaces like kube-system, kube-node-lease, kube-public and istio-system as well from the Istio CNI plugin.

apiVersion: install.istio.io/v1alpha1
kind: IstioOperator
spec:
  addonComponents:
    grafana:
      enabled: true
    tracing:
      enabled: true
    kiali:
      enabled: true
    prometheus:
      enabled: true
  components:
    cni:
      enabled: true
...
  values:
...
    cni:
      excludeNamespaces:
       - istio-system
       - kube-system
       - kube-node-lease
       - kube-public
...

Afterwards run istioctl manifest apply -f install-istio.yaml to apply the changes. The final step is rotating your application pods to rollout the changes for the Istio sidecar proxies. You can use the kubectl rollout restart deployment <deployment name> command to do so.

-> https://github.com/neumanndaniel/kubernetes/blob/master/istio/istio-1.5.yaml

Der Beitrag Switching to Istio CNI plugin on Azure Kubernetes Service erschien zuerst auf Daniel's Tech Blog.

Using distroless images in Istio on Azure Kubernetes Service

$
0
0

Looking at Docker Hub Istio provides the option using distroless images since version 1.3.0.

Docker Hub Istio proxy distroless image version 1.3.0

As it is always a good idea on a Kubernetes cluster to reduce the attack surface, especially when running a managed Kubernetes cluster like Azure Kubernetes Service, using distroless images is one option of it.

Per default Istio does not use the distroless image versions. So, you need to opt in for it. I encourage you to do so as a service mesh is one of your critical key components in your AKS cluster. Assuming you use a service mesh implementation like Istio.

The opt-in using distroless images in Istio can be done globally via the IstioOperator API.

Looking at the configurations for Istio 1.6.8 and 1.7.0 there is only a slight difference depending whether or not you enabled the Istio CNI plugin.

1.6.8 configuration example

apiVersion: install.istio.io/v1alpha1
kind: IstioOperator
spec:
  tag: 1.6.8-distroless
  ...
  components:
    cni:
      enabled: true
      tag: 1.6.8
...

1.7.0 configuration example

apiVersion: install.istio.io/v1alpha1
kind: IstioOperator
spec:
  tag: 1.7.0-distroless
...

The Istio CNI plugin  first supports distroless images with version 1.7.0. Thus, you use in version 1.6.8 the default image for the CNI plugin.

You find the IstioOperator API templates for Istio 1.6.8 and 1.7.0 in my GitHub repository.

-> https://github.com/neumanndaniel/kubernetes/blob/master/istio/istio-1.6.yaml
-> https://github.com/neumanndaniel/kubernetes/blob/master/istio/istio-1.7.yaml

Der Beitrag Using distroless images in Istio on Azure Kubernetes Service erschien zuerst auf Daniel's Tech Blog.

Troubleshooting Azure Kubernetes Service tunnel component issues

$
0
0

In Azure Kubernetes Service Microsoft manages the AKS control plane (Kubernetes API server, scheduler, etcd, etc.) for you. The AKS control plane interacts with the AKS nodes in your subscription via a secure connection that is established through the tunnelfront / aks-link component.

-> https://docs.microsoft.com/en-us/azure/aks/concepts-clusters-workloads#kubernetes-cluster-architecture

As you can run the AKS control plane within a free tier (SLO) or a paid tier (SLA) the tunnel component differs. For the free tier it is still the tunnelfront component compared to the paid tier with the aks-link component. In this blog post I am talking about the aks-link component using the AKS control plane with the paid tier (SLA) option.

The tunnel component runs in the kube-system namespace on your nodes.

> kubectl get pods -l app=aks-link -n kube-system
NAME                        READY   STATUS    RESTARTS   AGE
aks-link-7dd7c4b96f-986vs   2/2     Running   0          7m22s
aks-link-7dd7c4b96f-f5zr5   2/2     Running   0          7m22s

The issue

Let me tell you what happened today on one of our AKS clusters during a release of one of our microservices.

We received an error that we hit the timeout for calling the Istio webhook for the automatic sidecar injection. Istio uses a mutating webhook for the automatic sidecar injection.

[ReplicaSet/microservice]FailedCreate: Error creating: Internal error occurred: failed calling webhook 'sidecar-injector.istio.io': Post https://istiod.istio-system.svc:443/inject?timeout=30s: context deadline exceeded

Further investigation showed us that commands like kubectl get or describe run successfully. But kubectl logs runs into the typical timeout indicating at the first sight an issue with the control plane.

Error from server: Get https://aks-nodepool-12345678-vmss000001:10250/containerLogs/microservice/microservice-1234567890-ab123/microservice-container: dial tcp x.x.x.x:10250: i/o timeout

The resource health and the AKS Diagnostics showed no issues.

Azure Resource Health blade AKS Diagnostics blade AKS Diagnostics Cluster Insights results

Beside a warning in the resource health blade that a planned control plane update happened in the morning.

Degraded : Updating Control Plane (Planned)
At Tuesday, November 17, 2020, 6:22:41 AM GMT+1, the Azure monitoring system received the following information regarding your Azure Kubernetes Service (AKS):
Your cluster was updating. You may see this message if you created your cluster for the first time or if there is a routine update on your cluster.
Recommended Steps
No action is required. You cluster was updating. The control plane is fully managed by AKS. To learn more about which features on AKS are fully managed, check the Support Policies documentation.

As the AKS cluster was fully operational, no customer impact and beside we could not deploy anything, we opened a support ticket and started our own recovery procedures.

After a support engineer was assigned, we quickly identified and mitigated the issue. We just needed to restart the aks-link component and therefore stopped our own recovery procedures.

kubectl rollout restart deployment aks-link -n kube-system

Summary

The takeaway in this situation is restarting the aks-link component when the following conditions are met.

  • Resource health blade shows a healthy state or a warning
  • AKS Diagnostics shows a healthy state
  • kubectl commands like get and describe succeed as they only interact with the API server, control plane, itself
  • kubectl commands like logs fail as the control plane needs to interact with the kubelet component on the nodes
  • Deployments fail as the control plane needs to interact with the kubelet component on the nodes

The difference here is important. Calls only require the control plane succeed. But calls requiring interaction between the control plane and the nodes fail are a good indicator for an issue with the aks-link component.

Hence a restart of the aks-link component might solve this, and you do not need to reach out to the Azure Support.

Der Beitrag Troubleshooting Azure Kubernetes Service tunnel component issues erschien zuerst auf Daniel's Tech Blog.

Run the Envoy Proxy ratelimit service for Istio on AKS with Azure Cache for Redis

$
0
0

The Istio sidecar proxy uses Envoy and therefore supports two different rate limiting modes. A local one targeting only a single service and a global one targeting the entire service mesh.

The local rate limit implementation only requires Envoy itself without the need for a rate limit service. In contrast the global rate limit implementation requires a rate limit service as its backend.

Looking at Istio and Envoy there is a reference implementation available by the Envoy Proxy community: The Envoy Proxy ratelimit service.

-> https://github.com/envoyproxy/ratelimit

So, in today’s post I walk you through the setup of the Envoy Proxy ratelimit service using an Azure Cache for Redis as its backend storage.

First, we deploy the Azure Cache for Redis in our Azure subscription in the same region we have the Azure Kubernetes Service cluster running.

> az redis create --name ratelimit --resource-group ratelimit \
  --location northeurope --sku Standard --vm-size c0

The choice here is the Standard SKU and size C0. It is the smallest Redis instance on Azure which offers an SLA of 99,9%. But you can also choose the Basic SKU.

The repo of the ratelimit service only offers a Docker Compose file and no Kubernetes template or Helm Chart. Therefore, we build the template ourselves.

So, how will our deployment look like?

Envoy Proxy ratelimit service deployment

The entire deployment consists of a namespace, a deployment, a service, a secret, a network policy, a peer authentication policy and two configuration maps.

-> https://github.com/neumanndaniel/kubernetes/tree/master/envoy-ratelimit

Let us focus on the deployment template. It will roll out the ratelimit service and a sidecar container exporting Prometheus metrics.

I have chosen the following configuration for the ratelimit service which is passed over as environment variables.

...
        env:
          - name: USE_STATSD
            value: "true"
          - name: STATSD_HOST
            value: "localhost"
          - name: STATSD_PORT
            value: "9125"
          - name: LOG_FORMAT
            value: "json"
          - name: LOG_LEVEL
            value: "debug"
          - name: REDIS_SOCKET_TYPE
            value: "tcp"
          - name: REDIS_URL
            valueFrom:
              secretKeyRef:
                name: redis
                key: url
          - name: REDIS_AUTH
            valueFrom:
              secretKeyRef:
                name: redis
                key: password
          - name: REDIS_TLS
            value: "true"
          - name: REDIS_POOL_SIZE
            value: "5"
          - name: LOCAL_CACHE_SIZE_IN_BYTES # 25 MB local cache
            value: "26214400"
          - name: RUNTIME_ROOT
            value: "/data"
          - name: RUNTIME_SUBDIRECTORY
            value: "runtime"
          - name: RUNTIME_WATCH_ROOT
            value: "false"
          - name: RUNTIME_IGNOREDOTFILES
            value: "true"
...

The first part is the configuration for exporting the rate limit metrics. We pass the statsd exporter configuration over as a configuration map object and use the default settings from the ratelimit service repo.

-> https://github.com/envoyproxy/ratelimit/blob/main/examples/prom-statsd-exporter/conf.yaml

- name: LOG_FORMAT
  value: "json"
- name: LOG_LEVEL
  value: "debug"

I recommend setting the log format to json and for the introduction phase the debug log level.

Afterwards comes the Redis configuration where we only change the default values for enabling TLS and reducing the pool size from 10 to 5. The last setting is important not to exhaust the Azure Cache for Redis connection limit for our chosen SKU and size.

- name: REDIS_TLS
  value: "true"
- name: REDIS_POOL_SIZE
  value: "5"

Another important setting is the local cache which per default is turned off. The local cache only stores information about already exhausted rate limits and reduces calls to the Redis backend.

- name: LOCAL_CACHE_SIZE_IN_BYTES # 25 MB local cache
  value: "26214400"

As our Redis in azure has 250 MB storage I am using 25 MB for the local cache size. Ten percent from Redis total storage amount.

Looking at the runtime configuration we specify a different root and sub directory. Bu the important settings are RUNTIME_WATCH_ROOT and RUNTIME_IGNOREDOTFILES. First one should be set to false and the last one to true. This guarantees the correct loading of our rate limit configuration which we again pass in via a configuration map.

apiVersion: v1
kind: ConfigMap
metadata:
  name: ratelimit-config
  namespace: ratelimit
data:
  config.yaml: |-
    domain: ratelimit
    descriptors:
      - key: PATH
        value: "/src-ip"
        rate_limit:
          unit: second
          requests_per_unit: 1
      - key: remote_address
        rate_limit:
          requests_per_unit: 10
          unit: second
      - key: HOST
        value: "aks.danielstechblog.de"
        rate_limit:
          unit: second
          requests_per_unit: 5

In my rate limit configuration, I am using PATH, remote_address and HOST as rate limits. If you want, you can specify different config.yaml files in one configuration map to separate different rate limit configurations from each other.

In our Kubernetes service object definition, we expose all ports. The three different ports of the ratelimit service and the two ports of the statsd exporter.

ContainerPortDescription
ratelimit8080healthcheck and json endpoint
ratelimit8081GRPC endpoint
ratelimit6070debug endpoint
statsd-exporter9102Prometheus metrics endpoint
statsd-exporter9125statsd endpoint

Special configuration for Istio

Whether you want the ratelimit service to be part of the service mesh or not is a debatable point. I highly encourage you to include the ratelimit service in the service mesh. The Istio sidecar proxy provides insightful information when the Istio ingress gateway talks via GRPC with the ratelimit service. Especially when you run into errors. But this is part of the next blog post about connecting the Istio ingress gateway to the ratelimit service.

So, why do we need a peer authentication and network policy for the ratelimit service?

The issue is the GRPC protocol here. When you use a STRICT mTLS configuration in your service mesh you need another peer authentication policy. Otherwise, the ingress gateway cannot connect to the ratelimit service. This is a known issue in Istio, and it seems not to be fixed in the future.

apiVersion: "security.istio.io/v1beta1"
kind: "PeerAuthentication"
metadata:
  name: "ratelimit"
  namespace: "ratelimit"
spec:
  selector:
    matchLabels:
      app: ratelimit
  portLevelMtls:
    8081:
      mode: PERMISSIVE

Therefore, we use a namespace bound peer authentication policy setting the mTLS mode on the GRPC port to PERMISSIVE as seen above.

apiVersion: networking.k8s.io/v1
kind: NetworkPolicy
metadata:
  name: deny-all-inbound
  namespace: ratelimit
spec:
  podSelector: {}
  policyTypes:
  - Ingress
---
apiVersion: networking.k8s.io/v1
kind: NetworkPolicy
metadata:
  name: allow-istio-ingressgateway
  namespace: ratelimit
spec:
  podSelector:
    matchLabels:
      app: ratelimit
  policyTypes:
  - Ingress
  ingress:
  - from:
      - namespaceSelector: {}
        podSelector:
          matchLabels:
            istio: ingressgateway
    ports:
    - port: 8081

Using the above network policy ensures that only the Istio ingress gateway can talk to our ratelimit service. I highly recommend making use of a network policy in that case.

Envoy Proxy ratelimit service rollout

The rollout is done easily by running the setup.sh script.

-> https://github.com/neumanndaniel/kubernetes/blob/master/envoy-ratelimit/setup.sh

Before you run the script adjust the configuration map matching your rate limit configuration. Afterwards just specify the Azure Cache for Redis resource group and name as parameters.

> ./setup.sh ratelimit-redis istio-ratelimit

The ratelimit service should be up and running as seen in the screenshot.

Azure Kubernetes Dashboard ratelimit service CLI ratelimit service

Testing the ratelimit service functionality

Luckily, the project offers a GRPC client which we use to test the functionality of our ratelimit service configuration as well a REST API endpoint.

-> https://github.com/envoyproxy/ratelimit#grpc-client
-> https://github.com/envoyproxy/ratelimit#http-port

Let us start with the REST API endpoint. For that we need a test payload in JSON format.

{
  "domain": "ratelimit",
  "descriptors": [
    {
      "entries": [
        {
          "key": "remote_address",
          "value": "127.0.0.1"
        }
      ]
    },
    {
      "entries": [
        {
          "key": "PATH",
          "value": "/src-ip"
        }
      ]
    },
    {
      "entries": [
        {
          "key": "HOST",
          "value": "aks.danielstechblog.de"
        }
      ]
    }
  ]
}

We then use kubectl port-forward connecting to one of the pods.

> kubectl port-forward ratelimit-fb66b5547-qpqtk 8080:8080

Calling the endpoint / healthcheck in our browser returns an OK.

ratelimit service healthcheck endpoint

Our test payload is sent via curl to the json endpoint.

> DATA=$(cat payload.json)
> curl --request POST --data-raw "$DATA" http://localhost:8080/json | jq .
---
{
  "overallCode": "OK",
  "statuses": [
    {
      "code": "OK",
      "currentLimit": {
        "requestsPerUnit": 10,
        "unit": "SECOND"
      },
      "limitRemaining": 9,
      "durationUntilReset": "1s"
    },
    {
      "code": "OK",
      "currentLimit": {
        "requestsPerUnit": 1,
        "unit": "SECOND"
      },
      "durationUntilReset": "1s"
    },
    {
      "code": "OK",
      "currentLimit": {
        "requestsPerUnit": 5,
        "unit": "SECOND"
      },
      "limitRemaining": 4,
      "durationUntilReset": "1s"
    }
  ]
}

Now let us connect to the GRPC endpoint and talk to the ratelimit service.

> kubectl port-forward ratelimit-fb66b5547-qvhns 8081:8081
> ./client -dial_string localhost:8081 -domain ratelimit -descriptors PATH=/src-ip
---
domain: ratelimit
descriptors: [ <key=PATH, value=/src-ip> ]
response: overall_code:OK  statuses:{code:OK  current_limit:{requests_per_unit:1  unit:SECOND}  duration_until_reset:{seconds:1}}

Also, the GRPC endpoint looks good and our ratelimit service is fully operational.

Summary

It takes a bit of an effort to get the reference implementation of a rate limit service for Envoy up and running. But it is worthwhile the effort as you get a good performing rate limit service for your Istio service mesh implementation.

In the next blog post I walk you through the setup connection the Istio ingress gateway to the ratelimit service.

Der Beitrag Run the Envoy Proxy ratelimit service for Istio on AKS with Azure Cache for Redis erschien zuerst auf Daniel's Tech Blog.

Detecting SNAT port exhaustion on Azure Kubernetes Service

$
0
0

Running applications on an Azure Kubernetes Service cluster which make a lot of outbound calls might led to a SNAT port exhaustion.

In today’s blog article I walk you through how to detect and mitigate a SNAT port exhaustion on AKS.

What is a SNAT port exhaustion?

It is important to know what a SNAT port exhaustion is to apply the correct mitigation.

SNAT, Source Network Address Translation, is used in AKS whenever an outbound call to an external address is made. Assuming you use AKS in its standard configuration, it enables IP masquerading for the backend VMSS instances of the load balancer.

SNAT ports get allocated for every outbound connection to the same destination IP and destination port. The default configuration of an AKS cluster provides 64.000 SNAT ports with a 30-minute ide timeout before idle connections are released. Furthermore, AKS uses automatic allocation for the SNAT ports based on the number of nodes the cluster uses.

Number of nodesPre-allocated SNAT ports per node
1-501.024
51-100512
101-200256
201-400128
401-80064
801-1.00032

When running into a SNAT port exhaustion new outbound connections fail. So, it is important to detect a SNAT port exhaustion as early as possible.

How to detect a SNAT port exhaustion?

The guidance on Azure docs is well hidden.

-> https://docs.microsoft.com/en-us/azure/load-balancer/load-balancer-standard-diagnostics#how-do-i-check-my-snat-port-usage-and-allocation
-> https://docs.microsoft.com/en-us/azure/load-balancer/load-balancer-outbound-connections

In the end you check the metrics of your load balancer of the AKS cluster. The metric SNAT Connection Count shows you when a SNAT port exhaustion happened. Important step here is to add the filter for the connection state and set it to failed.

SNAT Connection Count Metric - Overall

You can filter even further on backend IP address level and apply splitting to it.

SNAT Connection Count Metric - Per backend IP address

A value higher than 0 is a SNAT port exhaustion. As not all AKS nodes running into the port exhaustion at the same time we use the following metrics Allocated SNAT Ports and Used SNAT Ports identifying how bad the SNAT port exhaustion is on the affected node(s).

SNAT Port Metrics

It is important using two filters here as otherwise we get an aggregated value which led to false assumptions. One for the protocol type set to TCP and the other one for the backend IP address set to the node that experiences the SNAT port exhaustion.

As seen above in the screenshot the used ports are not near nor equals the allocated ports. So, all good in this case. But when the used ports value gets near or equals the allocated ports value and SNAT Connection Count is also above 0 it is time for mitigating the issue.

Mitigating a SNAT port exhaustion

For AKS we have two different mitigation options that directly have an impact and solves the issue. The third option is more for a long-term strategy and an extension to the first one.

Our first option is the one which can be rolled out without architectural changes. We adjust the pre-allocated number of ports per node in the load balancer configuration. This disables the automatic allocation.

Per default in an AKS standard configuration the load balancer has one outbound public IP which results in 64.000 available ports. Each node in the cluster automatically gets a predefined number of ports assigned. The assignment is based on the number of nodes in the cluster as previously mentioned. Idle TCP connections get released after 30 minutes.

Assuming our AKS cluster uses the cluster autoscaler and can scale up to a maximum of 20 nodes. We then adjust the load balancer configuration that every node gets 3.000 ports pre-allocated compared to the default 1.024 without requiring an additional public IP. Larger values requiring additional outbound public IPs.

Furthermore, we set the TCP idle reset to 4 minutes releasing idle connections faster and free used SNAT ports.

An example Terraform configuration is shown below.

...
  network_profile {
    load_balancer_sku = "standard"
    outbound_type     = "loadBalancer"
    load_balancer_profile {
      outbound_ports_allocated  = "3000"
      idle_timeout_in_minutes   = "4"
      managed_outbound_ip_count = "1"
    }
    network_plugin     = "azure"
    network_policy     = "calico"
    dns_service_ip     = "10.0.0.10"
    docker_bridge_cidr = "172.17.0.1/16"
    service_cidr       = "10.0.0.0/16"
  }
...

The second option assigns a dedicated public IP to every node in the cluster. On the one hand it increases the costs for large AKS clusters but on the other hand it totally mitigates the SNAT issue as SNAT is not used anymore. You find the guidance in the Azure docs.

-> https://docs.microsoft.com/en-us/azure/aks/use-multiple-node-pools#assign-a-public-ip-per-node-for-your-node-pools

At the beginning of this section, I mentioned a third option that complements the first one. When you use a lot of Azure PaaS services like Azure Database for PostgreSQL, Azure Cache for Redis or Azure Storage for instance you should use them with Azure Private Link. Using Azure PaaS services via their public endpoints consumes SNAT ports.

Making use of Azure Private Link reduces the SNAT port usage in your AKS cluster even further.

-> https://docs.microsoft.com/en-us/azure/private-link/private-link-overview

Summary

Long story short keep an eye on the SNAT port usage of your AKS cluster. Especially when a lot of outbound calls are made to external systems whether these are Azure PaaS services or not.

One last remark we have one more option for the SNAT port exhaustion mitigation: Azure Virtual Network NAT.

-> https://docs.microsoft.com/en-us/azure/virtual-network/nat-overview

I did not mention it as I could not find any information if this is supported by AKS. It should be but I am not 100% sure. So, let us see.

Der Beitrag Detecting SNAT port exhaustion on Azure Kubernetes Service erschien zuerst auf Daniel's Tech Blog.

Implement rate limiting with Istio on Azure Kubernetes Service

$
0
0

In my last blog post I walked you through the setup of the rate limiting reference implementation: The Envoy Proxy ratelimit service.

-> https://www.danielstechblog.io/run-the-envoy-proxy-ratelimit-service-for-istio-on-aks-with-azure-cache-for-redis/

Our today’s topic is about connecting the Istio ingress gateway to the ratelimit service. The first step for us is the Istio documentation.

-> https://istio.io/latest/docs/tasks/policy-enforcement/rate-limit/

Connect Istio with the ratelimit service

Currently, the configuration of rate limiting in Istio is tied to the EnvoyFilter object. There is no abstracting resource available which makes it quite difficult to implement it. However, with the EnvoyFilter object we have access to all the goodness the Envoy API provides.

Let us start with the first Envoy filter that connects the Istio ingress gateway to the ratelimit service. This does not apply rate limiting to inbound traffic.

apiVersion: networking.istio.io/v1alpha3
kind: EnvoyFilter
metadata:
  name: filter-ratelimit
  namespace: istio-system
spec:
  workloadSelector:
    labels:
      istio: ingressgateway
  configPatches:
    - applyTo: HTTP_FILTER
      match:
        context: GATEWAY
        listener:
          filterChain:
            filter:
              name: "envoy.filters.network.http_connection_manager"
              subFilter:
                name: "envoy.filters.http.router"
      patch:
        operation: INSERT_BEFORE
        value:
          name: envoy.filters.http.ratelimit
          typed_config:
            "@type": type.googleapis.com/envoy.extensions.filters.http.ratelimit.v3.RateLimit
            domain: ratelimit
            failure_mode_deny: false
            timeout: 25ms
            rate_limit_service:
              grpc_service:
                envoy_grpc:
                  cluster_name: rate_limit_cluster
              transport_api_version: V3
    - applyTo: CLUSTER
      match:
        cluster:
          service: ratelimit.ratelimit.svc.cluster.local
      patch:
        operation: ADD
        value:
          name: rate_limit_cluster
          type: STRICT_DNS
          connect_timeout: 25ms
          lb_policy: ROUND_ROBIN
          http2_protocol_options: {}
          load_assignment:
            cluster_name: rate_limit_cluster
            endpoints:
            - lb_endpoints:
              - endpoint:
                  address:
                    socket_address:
                      address: ratelimit.ratelimit.svc.cluster.local
                      port_value: 8081

I do not walk you through all the lines, only through the important ones.

...
          typed_config:
            "@type": type.googleapis.com/envoy.extensions.filters.http.ratelimit.v3.RateLimit
            domain: ratelimit
            failure_mode_deny: false
            timeout: 25ms
            rate_limit_service:
              grpc_service:
                envoy_grpc:
                  cluster_name: rate_limit_cluster
              transport_api_version: V3
...

First the value for domain must match what you defined in the config map of the ratelimit service.

apiVersion: v1
kind: ConfigMap
metadata:
  name: ratelimit-config
  namespace: ratelimit
data:
  config.yaml: |-
    domain: ratelimit
...

The value for failure_mode_deny can be either set to false or true. If this value is set to true, the Istio ingress gateway returns an HTTP 500 error when it cannot reach the ratelimit service. This results in unavailability of your application. My recommendation, set the value to false ensuring the availability of your application.

The timeout value defines the time the ratelimit service needs to return a response on a request. It should not be set to high as otherwise your users will experience increased latency on their requests. Especially, when the ratelimit service is temporary unavailable. For Istio and the ratelimit service running on AKS and having the backing Azure Cache for Redis in the same Azure region as AKS I experienced that 25ms for the timeout is a reasonable value.

The last important value is cluster_name. Which provides the name we reference in the second patch of the Envoy filter.

...
    - applyTo: CLUSTER
      match:
        cluster:
          service: ratelimit.ratelimit.svc.cluster.local
      patch:
        operation: ADD
        value:
          name: rate_limit_cluster
          type: STRICT_DNS
          connect_timeout: 25ms
          lb_policy: ROUND_ROBIN
          http2_protocol_options: {}
          load_assignment:
            cluster_name: rate_limit_cluster
            endpoints:
            - lb_endpoints:
              - endpoint:
                  address:
                    socket_address:
                      address: ratelimit.ratelimit.svc.cluster.local
                      port_value: 8081

Basically, we define the FQDN of the ratelimit service object and port the Istio ingress gateway then connects to.

Rate limit actions

The Istio ingress gateway is now connected to the ratelimit service. However, we still missing the rate limit actions that matches our ratelimit service config map configuration.

apiVersion: networking.istio.io/v1alpha3
kind: EnvoyFilter
metadata:
  name: filter-ratelimit-svc
  namespace: istio-system
spec:
  workloadSelector:
    labels:
      istio: ingressgateway
  configPatches:
    - applyTo: VIRTUAL_HOST
      match:
        context: GATEWAY
        routeConfiguration:
          vhost:
            name: "*.danielstechblog.de:80"
            route:
              action: ANY
      patch:
        operation: MERGE
        value:
          rate_limits:
            - actions:
              - request_headers:
                  header_name: ":authority"
                  descriptor_key: "HOST"
            - actions:
              - remote_address: {}
            - actions:
              - request_headers:
                  header_name: ":path"
                  descriptor_key: "PATH"

Again, I walk you through the important parts.

...
        routeConfiguration:
          vhost:
            name: "*.danielstechblog.de:80"
            route:
              action: ANY
...

The routeConfiguration specifies the domain name and port the rate limit actions apply to.

...
        value:
          rate_limits:
            - actions:
              - request_headers:
                  header_name: ":authority"
                  descriptor_key: "HOST"
            - actions:
              - remote_address: {}
            - actions:
              - request_headers:
                  header_name: ":path"
                  descriptor_key: "PATH"

In this example configuration the rate limit actions apply to the domain name, the client IP, and the request path. This matches exactly our ratelimit service config map configuration.

...
    descriptors:
      - key: PATH
        value: "/src-ip"
        rate_limit:
          unit: second
          requests_per_unit: 1
      - key: remote_address
        rate_limit:
          requests_per_unit: 10
          unit: second
      - key: HOST
        value: "aks.danielstechblog.de"
        rate_limit:
          unit: second
          requests_per_unit: 5

After applying the rate limit actions, we test the rate limiting.

Successful request Rate limited request

As seen in the screenshots I am hitting the rate limit when calling the path /src-ip more than once per second.

Summary

It is a bit tricky to get the configuration done correctly for the EnvoyFilter objects. But when you got around it you can use all the goodness the Envoy API provides. Thus, saying the Istio documentation is no longer your friend here. Instead, you should familiarize yourself with the Envoy documentation.

-> https://www.envoyproxy.io/docs/envoy/latest/api-v3/extensions/filters/http/ratelimit/v3/rate_limit.proto

I added the Envoy filter YAML template to my GitHub repository and adjusted the setup script to include the template as well.

-> https://github.com/neumanndaniel/kubernetes/tree/master/envoy-ratelimit

So, what is next after the Istio ingress gateway got connected to the ratelimit service? Observability! Remember that statsd runs as a sidecar container together with the ratelimit service?

In the last blog post of this series, I will show you how to collect the Prometheus metrics of the ratelimit service with Azure Monitor for containers.

Der Beitrag Implement rate limiting with Istio on Azure Kubernetes Service erschien zuerst auf Daniel's Tech Blog.

Monitor the Envoy Proxy ratelimit service with Azure Monitor for containers

$
0
0

The last two blog posts of this series covered the setup of the Envoy Proxy ratelimit service and its implementation with Istio.

-> https://www.danielstechblog.io/run-the-envoy-proxy-ratelimit-service-for-istio-on-aks-with-azure-cache-for-redis/
-> https://www.danielstechblog.io/implement-rate-limiting-with-istio-on-azure-kubernetes-service/

In today’s post I walk you through on how to monitor the ratelimit service with Azure Monitor for containers. Not the standard monitoring of the container itself. We focus on the scraping of the Prometheus metrics exposed by the statsd-exporter.

statsd-exporter configuration adjustments

Per default metrics that have been sent to the statsd-exporter do not expire. Depending on the Azure Monitor agent collection interval, the default TTL in the statsd-exporter config map should match the collection interval. This guarantees accurate metrics of the ratelimit service in Azure Monitor.

In our example we set it to one minute.

...
---
apiVersion: v1
kind: ConfigMap
metadata:
  name: statsd-exporter-config
  namespace: ratelimit
data:
  config.yaml: |
    defaults:
      ttl: 1m # Resets the metrics every minute
    mappings:
...

For the config load metrics, we override the default TTL and set the value to three minutes. Otherwise, it might be that those metrics are not collected as those are only set ones during the container startup.

...
      - match:
          "ratelimit.service.config_load_success"
        name: "ratelimit_service_config_load_success"
        match_metric_type: counter
        ttl: 3m
      - match:
          "ratelimit.service.config_load_error"
        name: "ratelimit_service_config_load_error"
        match_metric_type: counter
        ttl: 3m
...

Ratelimit service deployment adjustments

Azure Monitor for containers supports different configuration options to scrape Prometheus metrics. The most convenient one is the monitoring of Kubernetes pods which have specific annotations set.

...
  template:
    metadata:
      labels:
        app: ratelimit
        version: v1
      annotations:
        prometheus.io/scrape: "true"
        prometheus.io/scheme: "http"
        prometheus.io/path: "/metrics"
        prometheus.io/port: "9102"
...

-> https://docs.microsoft.com/en-us/azure/azure-monitor/containers/container-insights-prometheus-integration

Additionally, we add an Istio specific annotation disabling the metrics merge.

...
        prometheus.istio.io/merge-metrics: "false"
...

-> https://istio.io/latest/docs/ops/integrations/prometheus/#option-1-metrics-merging

During my setup I discovered that the standard merge produces a male formatted result that the Azure Monitor agent cannot handle.

Network policy and peer authentication policy adjustments

As the ratelimit service namespace is locked down for inbound traffic and currently only allows GRPC traffic from the Istio ingress gateway to the ratelimit service we need to add another network policy.

...
apiVersion: networking.k8s.io/v1
kind: NetworkPolicy
metadata:
  name: allow-oms-agent
  namespace: ratelimit
spec:
  podSelector:
    matchLabels:
      app: ratelimit
  policyTypes:
  - Ingress
  ingress:
  - from:
      - namespaceSelector: {}
        podSelector:
          matchLabels:
            rsName: omsagent-rs
      - namespaceSelector: {}
        podSelector:
          matchLabels:
            component: oms-agent
    ports:
    - port: 9102

Without the additional network policy, the Azure Monitor agent cannot scrape the Prometheus metrics.

The same counts towards for the peer authentication policy. Per default services in our Istio service mesh use the mTLS mode STRICT.

Services that are not part of the mesh cannot talk to ones that are part of the mesh. Therefore, we set the mTLS mode for the metrics endpoint of the statsd-exporter to PERMISSIVE.

apiVersion: "security.istio.io/v1beta1"
kind: "PeerAuthentication"
metadata:
  name: "ratelimit"
  namespace: "ratelimit"
spec:
  selector:
    matchLabels:
      app: ratelimit
  portLevelMtls:
    8081:
      mode: PERMISSIVE
    9102:
      mode: PERMISSIVE

Otherwise, the Azure Monitor agent cannot scrape the metrics.

Azure Monitor for containers configuration

Microsoft provides a comprehensive documentation what can be configured.

-> https://docs.microsoft.com/en-us/azure/azure-monitor/containers/container-insights-agent-config
-> https://docs.microsoft.com/en-us/azure/azure-monitor/containers/container-insights-prometheus-integration

So, I keep the focus on what is configured in our example.

...
  prometheus-data-collection-settings: |-
    [prometheus_data_collection_settings.cluster]
      interval = "1m"
      fieldpass = [
        "ratelimit_service_config_load_success",
        "ratelimit_service_config_load_error",
        "ratelimit_service_rate_limit_near_limit",
        "ratelimit_service_rate_limit_over_limit",
        "ratelimit_service_rate_limit_total_hits",
        "ratelimit_service_rate_limit_within_limit",
        "ratelimit_service_should_rate_limit_error",
        "ratelimit_service_total_requests",
        "ratelimit_service_response_time_seconds"
      ]
      monitor_kubernetes_pods = true
      monitor_kubernetes_pods_namespaces = ["ratelimit"]

First, as earlier mentioned in this blog post the scraping interval is configured to one minute. We do not want to scrape all metrics from the statsd-exporter of our ratelimit service. Hence, we use the fieldpass option only scarping metrics we want.

Additionally, we limit the pod monitoring only to the ratelimit service namespace and enable the monitoring.

Run KQL queries

After we applied all configuration adjustments to our Azure Kubernetes Service cluster, we can start to run KQL queries analyzing the ingested metrics.

The first KQL query returns the results for the config load metrics.

InsightsMetrics
| where Namespace == "prometheus"
| where Name =='ratelimit_service_config_load_success' or Name =='ratelimit_service_config_load_error'
| extend json = todynamic(Tags)
| extend Pod = tostring(json.pod_name)
| summarize count() by Pod, Name, Value=Val
| render columnchart

azure monitor config load results

As seen in the screenshot the config load of the ratelimit service was successful and the ratelimit service is operational.

Another KQL query shows the different metrics for the rate limiting.

InsightsMetrics
| where Namespace == "prometheus"
| where Name =='ratelimit_service_rate_limit_total_hits' or Name == 'ratelimit_service_rate_limit_near_limit' or Name == 'ratelimit_service_rate_limit_over_limit' or Name == 'ratelimit_service_rate_limit_within_limit'
| extend json = todynamic(Tags)
| where json.key1 == 'PATH_/src-ip'
| project TimeGenerated, Name, Sum=Val
| render columnchart

azure monitor rate limiting results

The metrics for ratelimit_service_rate_limit_over_limit in this specific example is in total 12.

Beside this metric there is another way to receive information about specific paths that hit the rate limit. This only requires that the Istio logging is enabled.

ContainerLog
| where ContainerID == 'b07608b4e81be5f5e515255b954832dc0a56772303ca3d4fc0c9a44e7bcfa301' or ContainerID == 'fb91ee37f6e1b9b0f57d4b47cf2391f72bb4327f9bafa1e8df653bbdfe91a5af'
| extend json = todynamic(LogEntry)
| where json.response_code == '429' and json.path == '/src-ip'
| summarize count=count() by tostring(json.response_code), tostring(json.response_code_details), tostring(json.path), tostring(json.authority)

azure monitor istio ingress gateway logs

We have the same number of requests that got rate limited and did not need to scrape Prometheus metrics from the ratelimit service for it. Depending on how much insights you want the Istio logging might be enough. For deeper insights I recommend scraping the Prometheus metrics.

Summary

This is the last blog post of this series where we started with how to run the Envoy Proxy ratelimit service, implement the rate limiting with Istio and ended the topic how to monitor the ratelimit service.

-> https://www.danielstechblog.io/run-the-envoy-proxy-ratelimit-service-for-istio-on-aks-with-azure-cache-for-redis/
-> https://www.danielstechblog.io/implement-rate-limiting-with-istio-on-azure-kubernetes-service/
-> https://github.com/neumanndaniel/kubernetes/tree/master/envoy-ratelimit

I hope you got some useful information and insights on how to implement rate limiting for Istio on your AKS cluster and protect your microservices from being overloaded.

Der Beitrag Monitor the Envoy Proxy ratelimit service with Azure Monitor for containers erschien zuerst auf Daniel's Tech Blog.


Run the Istio ingress gateway with TLS termination and TLS passthrough

$
0
0

The Istio ingress gateway supports two modes for dealing with TLS traffic: TLS termination and TLS passthrough.

Running Istio with TLS termination is the default and standard configuration for most installations. Incoming TLS traffic is terminated at the Istio ingress gateway level and then sent to the destination service encrypted via mTLS within the service mesh.

Having the TLS passthrough configured the Istio ingress gateway passing through the TLS traffic directly to the destination service which then does the TLS termination.

Are both modes supported at the same time with the default ingress gateway configuration?

Sure, and that is today’s topic in this blog post.

Configuration – Istio ingress gateway

Our starting point is a standard Istio installation and ingress gateway configuration doing the TLS termination on port 443 for our wildcard domain configuration.

apiVersion: install.istio.io/v1alpha1
kind: IstioOperator
metadata:
  namespace: istio-system
  name: istiocontrolplane
spec:
  components:
    base:
      enabled: true
    cni:
      enabled: true
    ingressGateways:
      - enabled: true
        name: istio-ingressgateway
        k8s:
          hpaSpec:
            minReplicas: 2
          overlays:
            - apiVersion: v1
              kind: Service
              name: istio-ingressgateway
              patches:
                - path: spec.ports
                  value:
                    - name: status-port
                      port: 15021
                      targetPort: 15021
                      protocol: TCP
                    - name: http2
                      port: 80
                      targetPort: 8080
                      protocol: TCP
                    - name: https
                      port: 443
                      targetPort: 8443
                      protocol: TCP
    pilot:
      enabled: true
      k8s:
        hpaSpec:
          minReplicas: 2
  meshConfig:
    accessLogFile: "/dev/stdout"
    accessLogEncoding: "JSON"
  values:
    global:
      istiod:
        enableAnalysis: true
    cni:
      excludeNamespaces:
        - istio-system
        - kube-system
    pilot:
      env:
        PILOT_ENABLE_STATUS: true
    sidecarInjectorWebhook:
      rewriteAppHTTPProbe: true
apiVersion: networking.istio.io/v1beta1
kind: Gateway
metadata:
  name: azst-aks-gateway
  namespace: istio-config
spec:
  selector:
    istio: ingressgateway # use Istio default gateway implementation
  servers:
    - hosts:
        - "*.danielstechblog.de"
      port:
        number: 80
        name: http
        protocol: HTTP
      tls:
        httpsRedirect: true
    - hosts:
        - "*.danielstechblog.de"
      port:
        number: 443
        name: https
        protocol: HTTPS
      tls:
        mode: SIMPLE
        credentialName: istio-ingress-cert

Besides that, we want to have a dedicated port on the Istio ingress gateway for TLS traffic which is passed through the destination service.

The first step onto that path is the adjustment of the Istio configuration itself adding another port mapping on the HTTPS port 8443.

apiVersion: install.istio.io/v1alpha1
kind: IstioOperator
metadata:
  namespace: istio-system
  name: istiocontrolplane
spec:
  ...
    ingressGateways:
      - enabled: true
        name: istio-ingressgateway
        k8s:
          hpaSpec:
            minReplicas: 2
          overlays:
            - apiVersion: v1
              kind: Service
              name: istio-ingressgateway
              patches:
                - path: spec.ports
                  value:
                    - name: status-port
                      port: 15021
                      targetPort: 15021
                      protocol: TCP
                    - name: http2
                      port: 80
                      targetPort: 8080
                      protocol: TCP
                    - name: https
                      port: 443
                      targetPort: 8443
                      protocol: TCP
                    - name: tls-passthrough
                      port: 10443
                      targetPort: 8443
                      protocol: TCP
...

After rolling out this change we take the next configuration step adjusting the Istio gateway configuration.

apiVersion: networking.istio.io/v1beta1
kind: Gateway
metadata:
  name: azst-aks-gateway
  namespace: istio-config
spec:
  selector:
    istio: ingressgateway # use Istio default gateway implementation
  servers:
    - hosts:
        - "*.danielstechblog.de"
      port:
        number: 80
        name: http
        protocol: HTTP
      tls:
        httpsRedirect: true
    - hosts:
        - "*.danielstechblog.de"
      port:
        number: 443
        name: https
        protocol: HTTPS
      tls:
        mode: SIMPLE
        credentialName: istio-ingress-cert
    - hosts:
        - "*.tls.danielstechblog.de"
      port:
        number: 10443
        name: tls-passthrough
        protocol: TLS
      tls:
        mode: PASSTHROUGH

An important note here regarding the hosts parameter, you shall not use the same wildcard domain configuration as for your TLS Termination. Either use a wildcard subdomain or a full FQDN configuration.

If you want TLS termination and TLS passthrough on port 443 at the same time, you must configure the hosts parameter with full FQDNs instead of using a wildcard domain configuration. Same counts towards for the virtual services configuration then.

The Istio ingress gateway itself is instructed by the protocol and tls mode parameters whether it does or does not TLS termination. If set to TLS and PASSTHROUGH, as in our case, the ingress gateway passes through the TLS traffic to the destination service.

Configuration – Istio virtual service

Now everything is prepared moving onto the Istio virtual service configuration routing the traffic to our service, which is the NGINX example from the Istio docs.

-> https://istio.io/latest/docs/tasks/traffic-management/ingress/ingress-sni-passthrough/

apiVersion: networking.istio.io/v1beta1
kind: VirtualService
metadata:
  name: nginx
  namespace: istio-config
spec:
  hosts:
    - nginx.tls.danielstechblog.de
  gateways:
    - azst-aks-gateway
  tls:
    - match:
        - port: 10443
          sniHosts:
            - nginx.tls.danielstechblog.de
      route:
        - destination:
            host: my-nginx.nginx.svc.cluster.local
            port:
              number: 443

Instead of configuring an http match we are going to configure a tls match for the virtual service. The tls match requires the port and sniHosts parameter. In our case the port is 10443 and the sniHosts our FQDN.

After rolling out the virtual service configuration we call the NGINX service. For comparison I deployed an additional small web service written in go showing the standard TLS termination.

As seen in the screenshot below the certificate used by the Istio ingress gateway is issued by Let’s Encrypt

TLS termination

For the TLS passthrough example a self-signed certificate was generated. Those self-signed certificates are marked as unsecure as seen below.

TLS passthrough 01 TLS passthrough 02

Summary

Depending on what configuration you would like to use you can have TLS termination and TLS passthrough on port 443 which requires FQDNs instead of a wildcard domain configuration. The latter one must use another port mapping when you want to have TLS passthrough beside the default TLS termination on port 443 with a wildcard domain configuration.

The sample templates can be found on my GitHub repository.

-> https://github.com/neumanndaniel/kubernetes/tree/master/istio-tls-passthrough

Der Beitrag Run the Istio ingress gateway with TLS termination and TLS passthrough erschien zuerst auf Daniel's Tech Blog.

Preventing SNAT port exhaustion on Azure Kubernetes Service with Virtual Network NAT

$
0
0

Last year I have written a blog post about detecting SNAT port exhaustion on Azure Kubernetes Service.

-> https://www.danielstechblog.io/detecting-snat-port-exhaustion-on-azure-kubernetes-service/

Today we dive into the topic of how to prevent SNAT port exhaustion on Azure Kubernetes Service with Virtual Network NAT.

Since this year the managed NAT gateway option for Azure Kubernetes Service is generally available and can be set during the cluster creation.

-> https://docs.microsoft.com/en-us/azure/aks/nat-gateway?WT.mc_id=AZ-MVP-5000119

Unfortunately, as of writing this blog post, you cannot update existing Azure Kubernetes Service clusters with the outbound type loadBalancer to the outbound type managedNATGateway or userAssignedNATGateway.

Before we dive deeper into the topic of preventing SNAT port exhaustion on Azure Kubernetes Service let us step back and talk about what SNAT port exhaustion is.

What is SNAT port exhaustion?

SNAT, Source Network Address Translation, is used in AKS whenever an outbound call to an external address is made. Assuming you use AKS in its standard configuration, it enables IP masquerading for the backend VMSS instances of the load balancer.

SNAT ports get allocated for every outbound connection to the same destination IP and destination port. The default configuration of an Azure Kubernetes Service cluster provides 64.000 SNAT ports with a 30-minute idle timeout before idle connections are released.

When running into SNAT port exhaustion new outbound connections fail.

What is Virtual Network NAT?

Virtual Network NAT simplifies the outbound internet connectivity for a virtual network as a fully managed network address translation service. Once activated on a subnet all outbound connectivity is handled by Virtual Network NAT as it takes precedence over other configured outbound scenarios.

-> https://docs.microsoft.com/en-us/azure/virtual-network/nat-gateway/nat-overview?WT.mc_id=AZ-MVP-5000119#outbound-connectivity

Furthermore, the Virtual Network NAT can use up to 16 public IP addresses which results in 1032192 available SNAT ports that can be dynamically allocated on-demand for every resource in the subnet.

-> https://docs.microsoft.com/en-us/azure/virtual-network/nat-gateway/nat-gateway-resource?WT.mc_id=AZ-MVP-5000119#nat-gateway-dynamically-allocates-snat-ports

SNAT port exhaustion prevention options

Currently, you have two options to prevent workloads on an AKS cluster from running into SNAT port exhaustion.

Number one is to assign enough public IPs to the load balancer, set a custom value for the allocated SNAT ports per node, and set the TCP idle reset to 4 minutes.

The automatic default for the allocated SNAT ports per node depends on the cluster size and starts with 1024 SNAT ports and ends at 32 SNAT ports per node. Also, the default TCP idle reset is 30 minutes.

In the end, you are still at risk of running into SNAT port exhaustion.

Number two is to use the Virtual Network NAT. But do not use the outbound type managedNATGateway or userAssignedNATGateway in the Azure Kubernetes Service configuration.

Using Virtual Network NAT

So, why should you still stick to the outbound type loadBalancer in the Azure Kubernetes Service configuration? Remember what I wrote at the beginning of the blog post?

Once activated on a subnet all outbound connectivity is handled by Virtual Network NAT as it takes precedence over other configured outbound scenarios. When you use managedNATGateway or userAssignedNATGateway you cannot recover yourself from a Virtual Network NAT outage without redeploying the Azure Kubernetes Service cluster. This also counts towards enabling those outbound types on existing Azure Kubernetes Service clusters, you must redeploy the cluster.

Using the outbound type loadBalancer lets you disassociate the Virtual Network NAT from the subnet and AKS will leverage the outbound rules from the load balancer for outbound connectivity in case of a Virtual Network NAT outage. Also, this configuration lets you switch to Virtual Network NAT on an existing Azure Kubernetes Service cluster.

Let us see this configuration option in action.

I simply deployed an Azure Kubernetes Service cluster via the Azure portal with the Azure CNI plugin enabled. So, the load balancer of the cluster is configured with the default values like the TCP idle reset of 30 minutes. Furthermore, I deployed a Virtual Network NAT gateway with a TCP idle reset of 4 minutes and did not associate the NAT gateway with the AKS subnet yet.

-> https://docs.microsoft.com/en-us/azure/aks/learn/quick-kubernetes-deploy-portal?WT.mc_id=AZ-MVP-5000119
-> https://docs.microsoft.com/en-us/azure/virtual-network/nat-gateway/quickstart-create-nat-gateway-portal?WT.mc_id=AZ-MVP-5000119#nat-gateway

Azure Dashboard showing SNAT statistics

As seen in the screenshot above all outbound connectivity gets handled by the load balancer as the AKS nodes got a fixed amount of SNAT ports assigned to them.

Azure Dashboard showing SNAT statistics Azure Dashboard showing SNAT statistics

Now we associate the NAT gateway with the AKS subnet. It takes a while till all outbound connectivity gets handled by the NAT gateway due to the default TCP idle reset of 30 minutes of the load balancer.

An important note at this point from the Azure documentation:

When NAT gateway is configured to a virtual network where standard Load balancer with outbound rules already exists, NAT gateway will take over all outbound traffic moving forward. There will be no drops in traffic flow for existing connections on Load balancer. All new connections will use NAT gateway.

-> https://docs.microsoft.com/en-us/azure/virtual-network/nat-gateway/nat-overview?WT.mc_id=AZ-MVP-5000119#outbound-connectivity

The transfer from the load balancer to the NAT gateway is seamless for your workloads running on AKS.

Azure Dashboard showing SNAT statistics

In case of a Virtual Network NAT outage, you simply disassociate the NAT gateway from the AKS subnet, and outbound connectivity is handled again by the load balancer as seen above in the screenshot.

Summary

The most effective way for you to prevent SNAT port exhaustion on an Azure Kubernetes Service cluster is the usage of Virtual Network NAT.

Depending on your needs you can use the above-described configuration enabling Virtual Network NAT for existing Azure Kubernetes Service clusters and have a DR strategy in place when it comes to a Virtual Network NAT outage. The configuration as described above allows you to reestablish outbound connectivity of your workloads till a Virtual Network NAT outage has been resolved.

Or you deploy a new Azure Kubernetes Service cluster with the outbound type managedNATGateway or userAssignedNATGateway enabled.

But as of writing this blog post, you cannot update existing Azure Kubernetes Service clusters with the outbound type loadBalancer to the outbound type managedNATGateway or userAssignedNATGateway nor you can switch back to the outbound type loadBalancer without redeploying an Azure Kubernetes Service cluster if it has been provisioned with the managedNATGateway or userAssignedNATGateway option.

That said in case of a Virtual Network NAT outage, and you depend on outbound connectivity for your workloads the official configuration for using Virtual Network NAT on AKS with the outbound types managedNATGateway or userAssignedNATGateway might not be the one you would like to use.

Der Beitrag Preventing SNAT port exhaustion on Azure Kubernetes Service with Virtual Network NAT erschien zuerst auf Daniel's Tech Blog.

Configuring Istio using the Kubernetes Gateway API

$
0
0

The Kubernetes Gateway API is the successor of the Kubernetes Ingress API and is currently in beta state. More and more projects add support for the Gateway API like Istio.

-> https://istio.io/latest/blog/2022/gateway-api-beta/
-> https://istio.io/latest/blog/2022/getting-started-gtwapi/

In today’s blog post, I walk you through how to configure Istio using the Kubernetes Gateway API. At the time of writing, I am running my Azure Kubernetes Service cluster with Kubernetes version 1.25.6. The Istio version is 1.17.2 and the Gateway API version is 0.6.2.

 Scenario

I cover the following scenarios with my Gateway API configuration for Istio. First, the Istio ingress gateway gets created in the istio-system namespace. Same as with the standard Istio installation. Second, the routing configuration is placed into a dedicated namespace called istio-config to separate the Istio installation from the configuration of the service routing. The last scenario is the automatic redirection of HTTP traffic to HTTPS.

Install Kubernetes Gateway API CRDs

Before we can use the Gateway API on an Azure Kubernetes Service cluster, we must install the Gateway API CRDs. In total, we install four custom resource definitions, short CRDs. The GatewayClass, Gateway, HTTPRoute, and ReferenceGrant.

GATEWAY_API_TAG='v0.6.2'
 kubectl apply -f "https://raw.githubusercontent.com/kubernetes-sigs/gateway-api/$GATEWAY_API_TAG/config/crd/standard/gateway.networking.k8s.io_gatewayclasses.yaml"
 kubectl apply -f "https://raw.githubusercontent.com/kubernetes-sigs/gateway-api/$GATEWAY_API_TAG/config/crd/standard/gateway.networking.k8s.io_gateways.yaml"
 kubectl apply -f "https://raw.githubusercontent.com/kubernetes-sigs/gateway-api/$GATEWAY_API_TAG/config/crd/standard/gateway.networking.k8s.io_httproutes.yaml"
 kubectl apply -f "https://raw.githubusercontent.com/kubernetes-sigs/gateway-api/$GATEWAY_API_TAG/config/crd/standard/gateway.networking.k8s.io_referencegrants.yaml"

When you follow the Istio documentation and use the kustomize command, you only install three CRDs. The ResourceGrant CRD is not part of the kustomize template but required to fulfill our second scenario.

-> https://istio.io/latest/docs/tasks/traffic-management/ingress/gateway-api/

Set up the Istio ingress gateway

After the CRD installation, we proceed with the definition to configure the Istio ingress gateway. The gateway configuration is kept simple and consists of the two required spec sections gatewayClassName and listeners.

apiVersion: gateway.networking.k8s.io/v1beta1
kind: Gateway
metadata:
  name: gw-api
  namespace: istio-system
spec:
  gatewayClassName: istio
  listeners:
  ...

For the gatewayClassName, we use istio as this is the name of the GatewayClass resource in our case.

❯ kubectl get gatewayclasses.gateway.networking.k8s.io
NAME    CONTROLLER                    ACCEPTED   AGE
istio   istio.io/gateway-controller   True       9d

We define two listeners, one for HTTP and one for HTTPS traffic.

...
    - name: http
      hostname: "*.danielstechblog.de"
      port: 80
      protocol: HTTP
      allowedRoutes:
        namespaces:
          from: Same
        kinds:
          - group: gateway.networking.k8s.io
            kind: HTTPRoute
...

The one for HTTP traffic restricts the route configuration to the same namespace in which the Istio ingress gateway gets deployed. We will talk about the why in the section about the HTTP to HTTPS traffic redirection. Also, the route configuration is restricted to the kind HTTPRoute.

Allowed routes can be configured beside the value Same with two other values. All to allow route configuration from every namespace or Selector to allow them only from namespaces with a specific label as seen in the HTTPS listener configuration below.

...
    - name: https
      hostname: "*.danielstechblog.de"
      port: 443
      protocol: HTTPS
      allowedRoutes:
        namespaces:
          from: Selector
          selector:
            matchLabels:
              ingress-configuration: "true"
        kinds:
          - group: gateway.networking.k8s.io
            kind: HTTPRoute
      tls:
        mode: Terminate
        certificateRefs:
          - kind: Secret
            group: ""
            name: istio-ingress-cert
            namespace: istio-system

The HTTPS listener configuration has an additional tls section for the HTTPS configuration. Which mode should be used, Terminate or Passthrough? Furthermore, we specify at least one certificate reference. Per default, the certificate reference uses the same namespace as the ingress gateway.

Currently, the Istio ingress gateway deployed by the Kubernetes Gateway API runs only with one replica. We must deploy a horizontal pod autoscaler and a pod disruption budget resource having the same configuration as the default Istio ingress gateway.

apiVersion: autoscaling/v2
kind: HorizontalPodAutoscaler
metadata:
  name: gw-api
spec:
  scaleTargetRef:
    apiVersion: apps/v1
    kind: Deployment
    name: gw-api-istio
  minReplicas: 3
  maxReplicas: 6
  metrics:
    - type: Resource
      resource:
        name: cpu
        target:
          type: Utilization
          averageUtilization: 80
---
apiVersion: policy/v1
kind: PodDisruptionBudget
metadata:
  name: gw-api
spec:
  minAvailable: 50%
  selector:
    matchLabels:
      istio.io/gateway-name: gw-api

Adding those additional resources ensures a highly available ingress gateway.

Configure HTTP routing

Let us start with the routing configuration for the HTTP to HTTPS redirect.

apiVersion: gateway.networking.k8s.io/v1beta1
kind: HTTPRoute
metadata:
  name: http-to-https-redirect
  namespace: istio-system
spec:
  parentRefs:
    - name: gw-api
      namespace: istio-system
  hostnames:
    - "*.danielstechblog.de"
  rules:
    - filters:
        - type: RequestRedirect
          requestRedirect:
            scheme: https
            statusCode: 301
            port: 443

The routing configuration is attached with a parent reference to the respective ingress gateway. Under the rules section, the actual configuration happens how traffic is handled.

In the case of the redirect, we use a filter of type RequestRedirect. Even we use the scheme https, we must specify the port, 443, as otherwise, the redirect uses port 80.

HTTP redirect configuration error

❯ curl -sIL http://gwapi.danielstechblog.de
HTTP/1.1 301 Moved Permanently
location: https://gwapi.danielstechblog.de:80/
date: Thu, 18 May 2023 21:02:14 GMT
server: istio-envoy
transfer-encoding: chunked

Now the explanation of why we restrict the routing configuration of the HTTP listener to the istio-system namespace or in general, to a dedicated namespace. For instance, using All or placing the redirect routing configuration into the same namespace as the other configurations and using the Selector option would allow HTTP traffic to the services directly instead of redirecting traffic from HTTP to HTTPS.

❯ curl -sIL http://gwapi.danielstechblog.de
HTTP/1.1 200 OK
date: Thu, 18 May 2023 20:56:17 GMT
content-length: 107
content-type: text/html; charset=utf-8
x-envoy-upstream-service-time: 8
server: istio-envoy

Using a dedicated namespace lets the redirect work as intended.

❯ curl -sIL http://gwapi.danielstechblog.de
HTTP/1.1 301 Moved Permanently
location: https://gwapi.danielstechblog.de:443/
date: Thu, 18 May 2023 20:51:18 GMT
server: istio-envoy
transfer-encoding: chunked

HTTP/2 200
date: Thu, 18 May 2023 20:51:18 GMT
content-length: 107
content-type: text/html; charset=utf-8
x-envoy-upstream-service-time: 5
server: istio-envoy

After putting the redirect into place, we continue our routing configuration, enabling our application to receive traffic.

apiVersion: gateway.networking.k8s.io/v1beta1
kind: HTTPRoute
metadata:
  name: go-webapp
  namespace: istio-config
spec:
  parentRefs:
    - name: gw-api
      namespace: istio-system
  hostnames:
    - "*.danielstechblog.de"
  rules:
    - backendRefs:
        - name: go-webapp-gw-api
          namespace: go-webapp
          port: 80

The routing configuration for our application is deployed, as mentioned in the scenarios, to a namespace called istio-config. We use a backend reference under the rules section to direct traffic to our application. Directing traffic to the root path / does not require anything else in this case.

Besides the routing configuration, we need a ReferenceGrant resource in the application namespace, as the routing configuration lives in a different namespace than our application.

apiVersion: gateway.networking.k8s.io/v1beta1
kind: ReferenceGrant
metadata:
  name: go-webapp
  namespace: go-webapp
spec:
  from:
    - group: gateway.networking.k8s.io
      kind: HTTPRoute
      namespace: istio-config
  to:
    - group: ""
      kind: Service
      name: go-webapp-gw-api

A reference grant allows the backend reference from a routing configuration that lives in a different namespace. We can specify in the to section if we want to allow the backend reference to all Kubernetes service objects or only a specific one like go-webapp-gw-api in the example above.

Can I run Istio in both modes in parallel?

Istio supports running both modes in parallel. As long as we have specified the Istio ingress gateway in our IstioOperator template, we will get it deployed and can add an Istio ingress gateway via the Kubernetes Gateway API besides the default one.

Istio using both modes. Default and Kubernetes Gateway API

In the screenshot above we see an Istio installation using both modes in parallel on the same Kubernetes cluster.

The application served by the Istio ingress gateway deployed via the Gateway API is presented on the left side and returns a red page. Vice versa, on the right side, we see the application served by the default Istio ingress gateway, returning a blue page.

Summary

Setting up and configuring the Istio ingress gateway via the Kubernetes Gateway API is straightforward. Yes, some quirks need to be considered like the horizontal pod autoscaler and the pod disruption budget. But the Gateway API looks very promising to be the standard in the future for ingress configuration as well as for the service mesh configuration which is currently driven by the GAMMA initiative. Hence, you should give it a try and get familiar with the Kubernetes Gateway API whether you are using Istio or not.

You can find my configuration examples in my GitHub repository.

-> https://github.com/neumanndaniel/kubernetes/tree/master/gateway-api

Additional resources about the Kubernetes Gateway API are linked below.

-> https://kubernetes.io/blog/2022/07/13/gateway-api-graduates-to-beta/
-> https://gateway-api.sigs.k8s.io/
-> https://gateway-api.sigs.k8s.io/contributing/gamma/
-> https://github.com/kubernetes-sigs/gateway-api

Der Beitrag Configuring Istio using the Kubernetes Gateway API erschien zuerst auf Daniel's Tech Blog.

Azure Load Testing news

$
0
0

I have been using Azure Load Testing for my Azure Chaos Studio demos for a while now. The service provides an on-demand infrastructure to run your load tests as a managed service.

Recently, the service received some significant updates I like to share with you.

The first update targets the test duration. Previously limited to three hours max, you can now request an increase to 24 hours. That opens up some new testing scenarios.

-> https://azure.microsoft.com/en-us/updates/azure-load-testing-run-tests-for-up-to-24-hours/?wt.mc_id=AZ-MVP-5000119

The second update also increases a previous limit. You can now use up to 400 engine instances per test run. That results into test runs simulating up to 100.000 virtual users.

-> https://azure.microsoft.com/en-us/updates/azure-load-testing-run-tests-with-100000-virtual-users/?wt.mc_id=AZ-MVP-5000119

Last but not least, the preview of the Azure CLI support arrived.

-> https://azure.microsoft.com/en-us/updates/azure-load-testing-create-and-manage-tests-and-test-runs-using-azure-cli/?wt.mc_id=AZ-MVP-5000119

Der Beitrag Azure Load Testing news erschien zuerst auf Daniel's Tech Blog.

Using HTTP status code 307/308 for HTTPS redirect with the Istio ingress gateway

$
0
0

The gateway definition for the Istio ingress gateway provides a configuration parameter to enable the HTTPS redirect of HTTP connections.

-> https://istio.io/latest/docs/reference/config/networking/gateway/#ServerTLSSettings

apiVersion: networking.istio.io/v1beta1
kind: Gateway
metadata:
  name: azst-aks-gateway
  namespace: istio-config
spec:
  selector:
    istio: ingressgateway # use Istio default gateway implementation
  servers:
  - hosts:
    - "*.danielstechblog.de"
    port:
      number: 80
      name: http
      protocol: HTTP
    tls:
      httpsRedirect: true
  - hosts:
    - "*.danielstechblog.de"
    port:
      number: 443
      name: https
      protocol: HTTPS
    tls:
      mode: SIMPLE
      credentialName: istio-ingress-cert

When the httpsRedirect parameter is true, the Istio ingress gateway sends a 301 redirect for HTTP connections to use HTTPS.

For most scenarios, this is sufficient enough. The downside of using a 301 redirect is that a POST method might arrive as a GET request at the HTTPS endpoint and cause unexpected behavior from a user perspective. Even though the specification requires that the method and body remain unchanged, not all user agents follow this. It applies to the 302 redirect as well.

-> https://developer.mozilla.org/en-US/docs/Web/HTTP/Status/301
-> https://developer.mozilla.org/en-US/docs/Web/HTTP/Status/302

To provide an expected and consistent user experience you use a 307 or 308 redirect. Both redirects guarantee that the method and body remain unchanged. Unfortunately, some web applications use the 308 redirect in a non-standard way. Hence, using the 307 redirect is the most generic way.

-> https://developer.mozilla.org/en-US/docs/Web/HTTP/Status/307
-> https://developer.mozilla.org/en-US/docs/Web/HTTP/Status/308

Let us now dive into the configuration for the Istio ingress gateway.

Using a 307/308 HTTP redirect on Istio

When we want to provide a custom redirect like the 307 redirect, we need two gateway definitions: One for the actual HTTP to HTTP redirect and a second one that handles the ingress routing to the correct application.

The issue with only having one gateway definition is that the HTTP to HTTPS redirect acts as a catch-all directive in the routing chain. In the case of a matching entry in the routing chain, requests to an application would be served unencrypted via HTTP instead of encrypted via HTTPS.

Below is the first gateway definition for the 307 redirect.

apiVersion: networking.istio.io/v1beta1
kind: Gateway
metadata:
  name: azst-aks-gateway-redirect
  namespace: istio-config
spec:
  selector:
    istio: ingressgateway # use Istio default gateway implementation
  servers:
  - hosts:
    - "*.danielstechblog.de"
    port:
      number: 80
      name: http
      protocol: HTTP

Here is the second one for the actual ingress routing.

apiVersion: networking.istio.io/v1beta1
kind: Gateway
metadata:
  name: azst-aks-gateway
  namespace: istio-config
spec:
  selector:
    istio: ingressgateway # use Istio default gateway implementation
  servers:
  - hosts:
    - "*.danielstechblog.de"
    port:
      number: 443
      name: https
      protocol: HTTPS
    tls:
      mode: SIMPLE
      credentialName: istio-ingress-cert

Now, we apply the following virtual service definition to the gateway that does the 307 redirect.

apiVersion: networking.istio.io/v1beta1
kind: VirtualService
metadata:
  name: redirect
  namespace: istio-config
spec:
  gateways:
    - azst-aks-gateway-redirect
  hosts:
    - "*.danielstechblog.de"
  http:
    - name: redirect
      redirect:
        redirectCode: 307
        scheme: https

A quick validation with the following curl command shows that the 307 redirect works.

❯ curl -sIL http://aks.danielstechblog.de
HTTP/1.1 307 Temporary Redirect
location: https://aks.danielstechblog.de/
date: Tue, 05 Dec 2023 21:12:52 GMT
server: istio-envoy
transfer-encoding: chunked

HTTP/2 200
date: Tue, 05 Dec 2023 21:12:52 GMT
content-length: 1487
content-type: text/html; charset=utf-8
x-envoy-upstream-service-time: 12
server: istio-envoy

Browser with debug tools - networking tab

Summary

We have to keep several things in mind for the 307 redirect implementation, and it might be that the built-in 301 redirect is enough for your use cases. So, you can go with that or with a few configuration changes using a custom redirect.

You can find the example configurations in my GitHub repository.

-> https://github.com/neumanndaniel/kubernetes/tree/master/istio-custom-redirect

Der Beitrag Using HTTP status code 307/308 for HTTPS redirect with the Istio ingress gateway erschien zuerst auf Daniel's Tech Blog.

Viewing all 47 articles
Browse latest View live